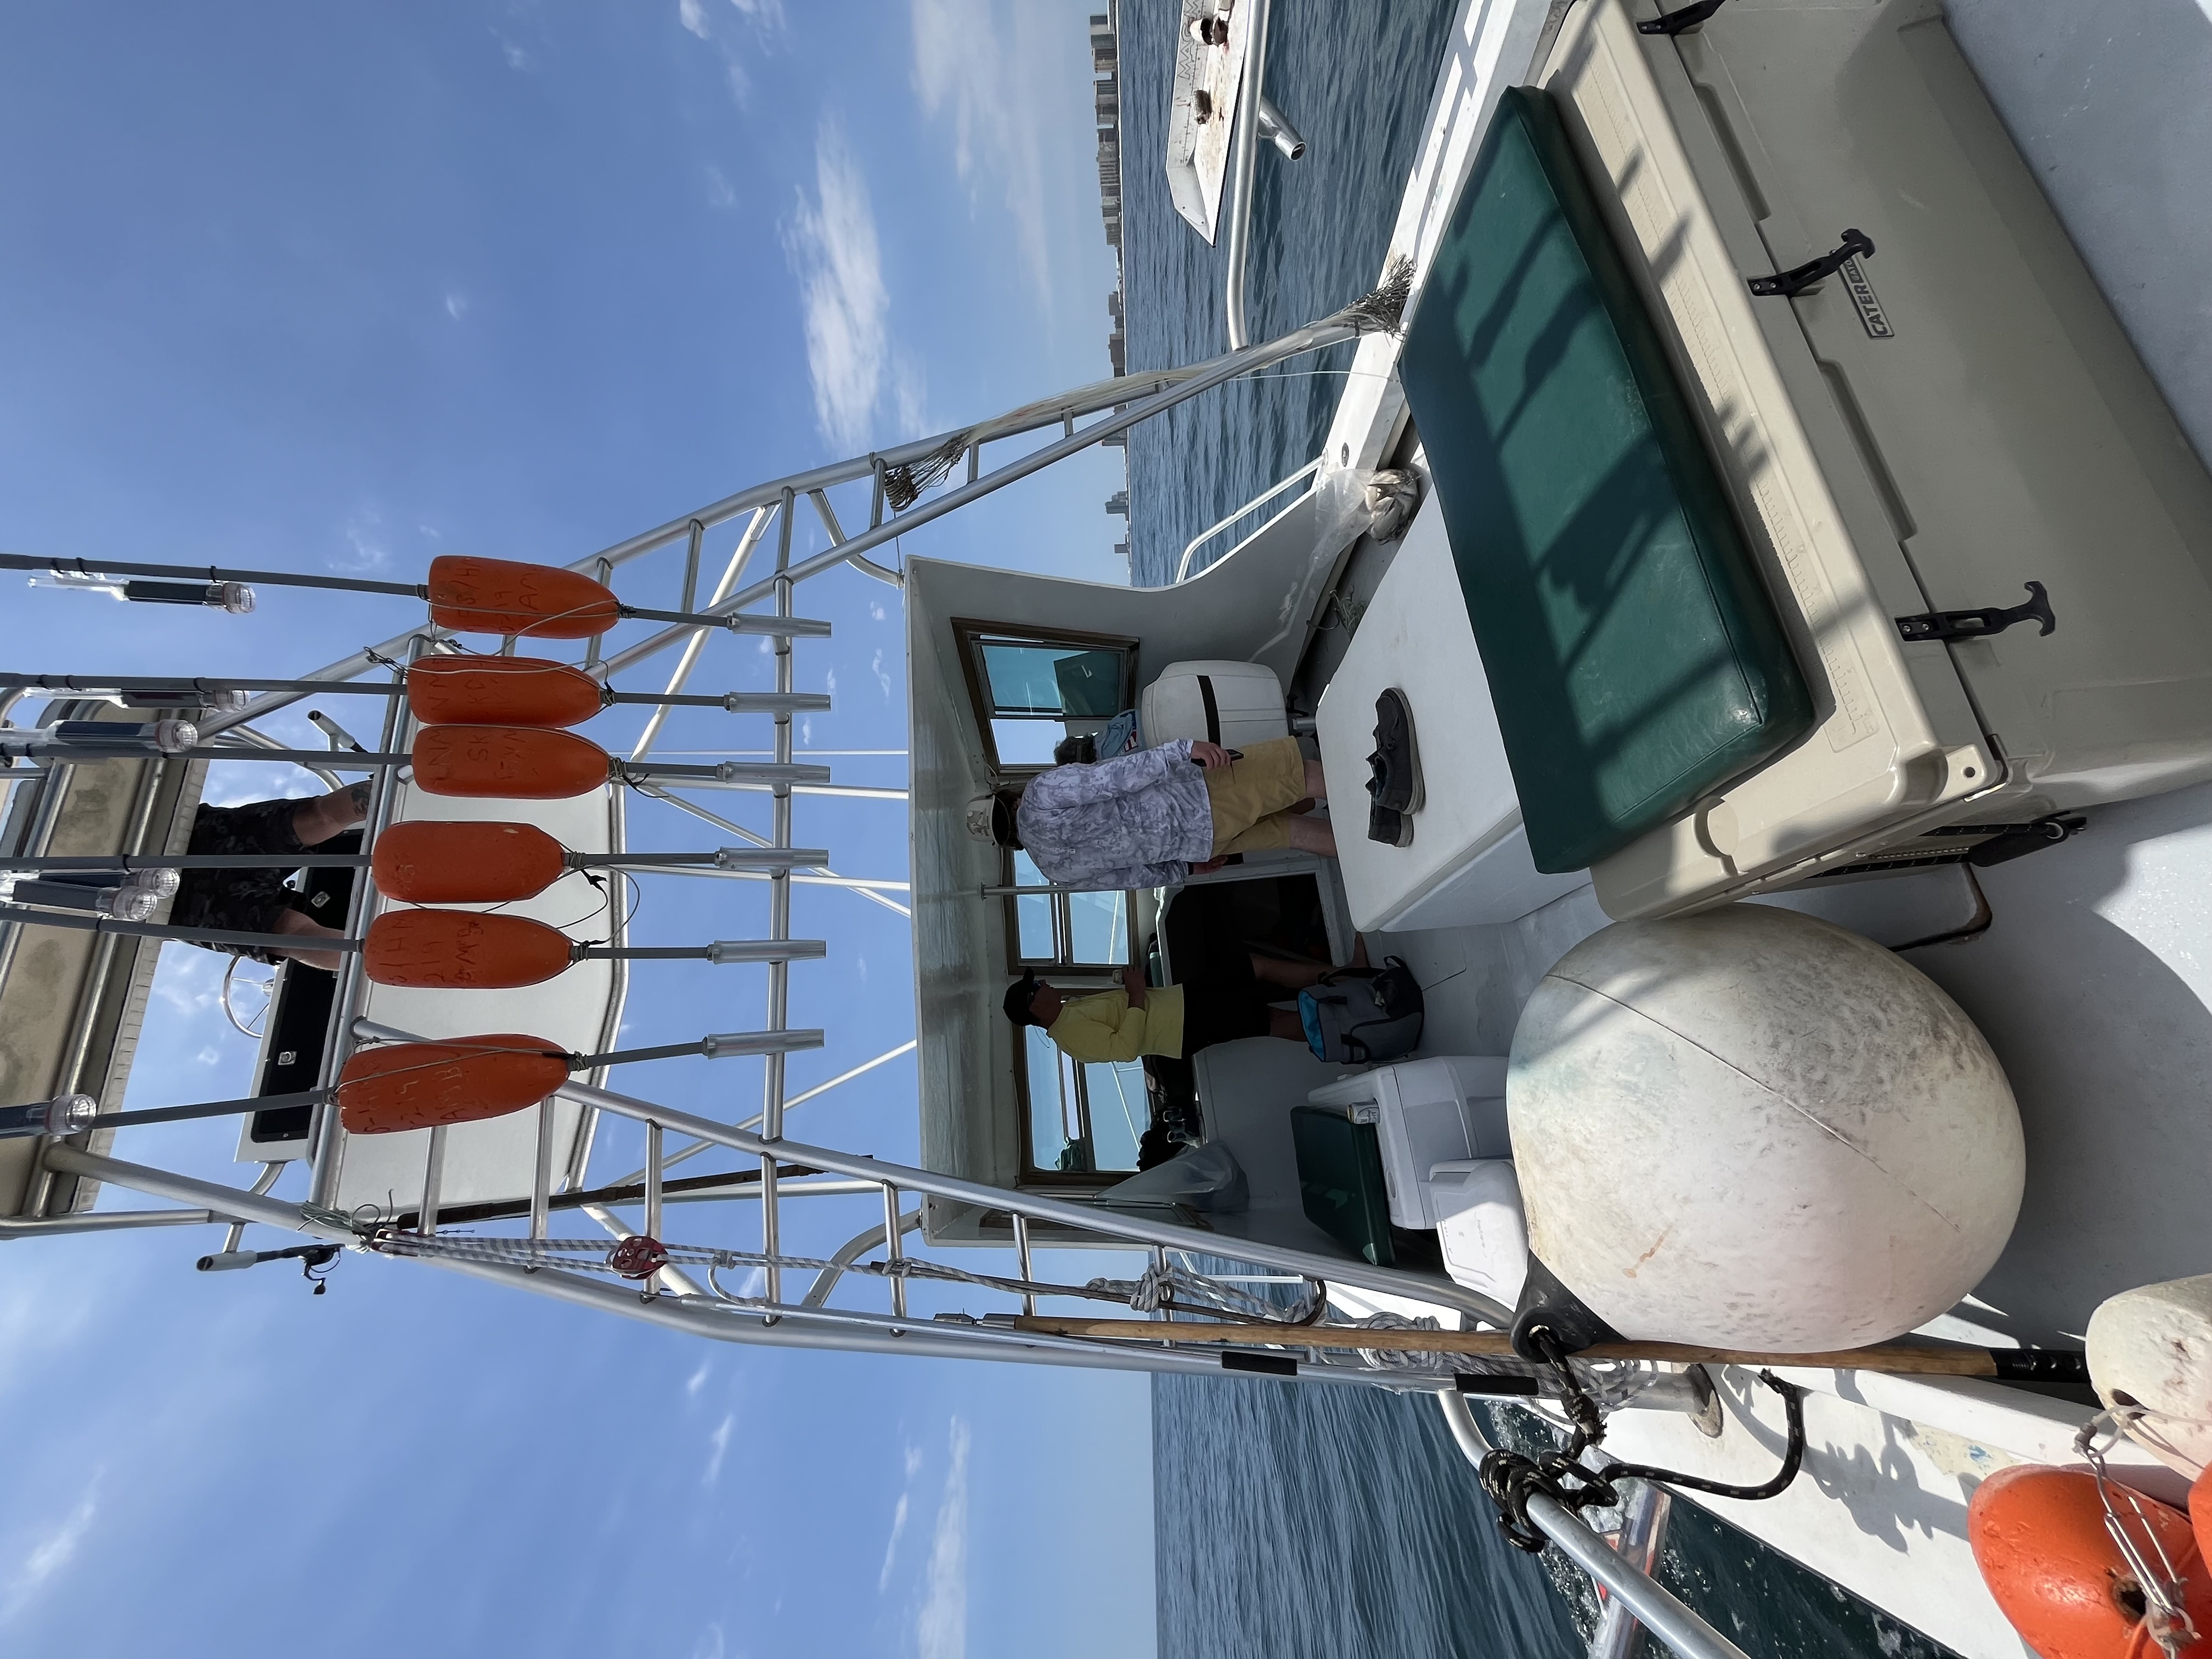
Inshore, Nearshore Fishing in Orange Beach
Spring Break 6 Hour Special Rate
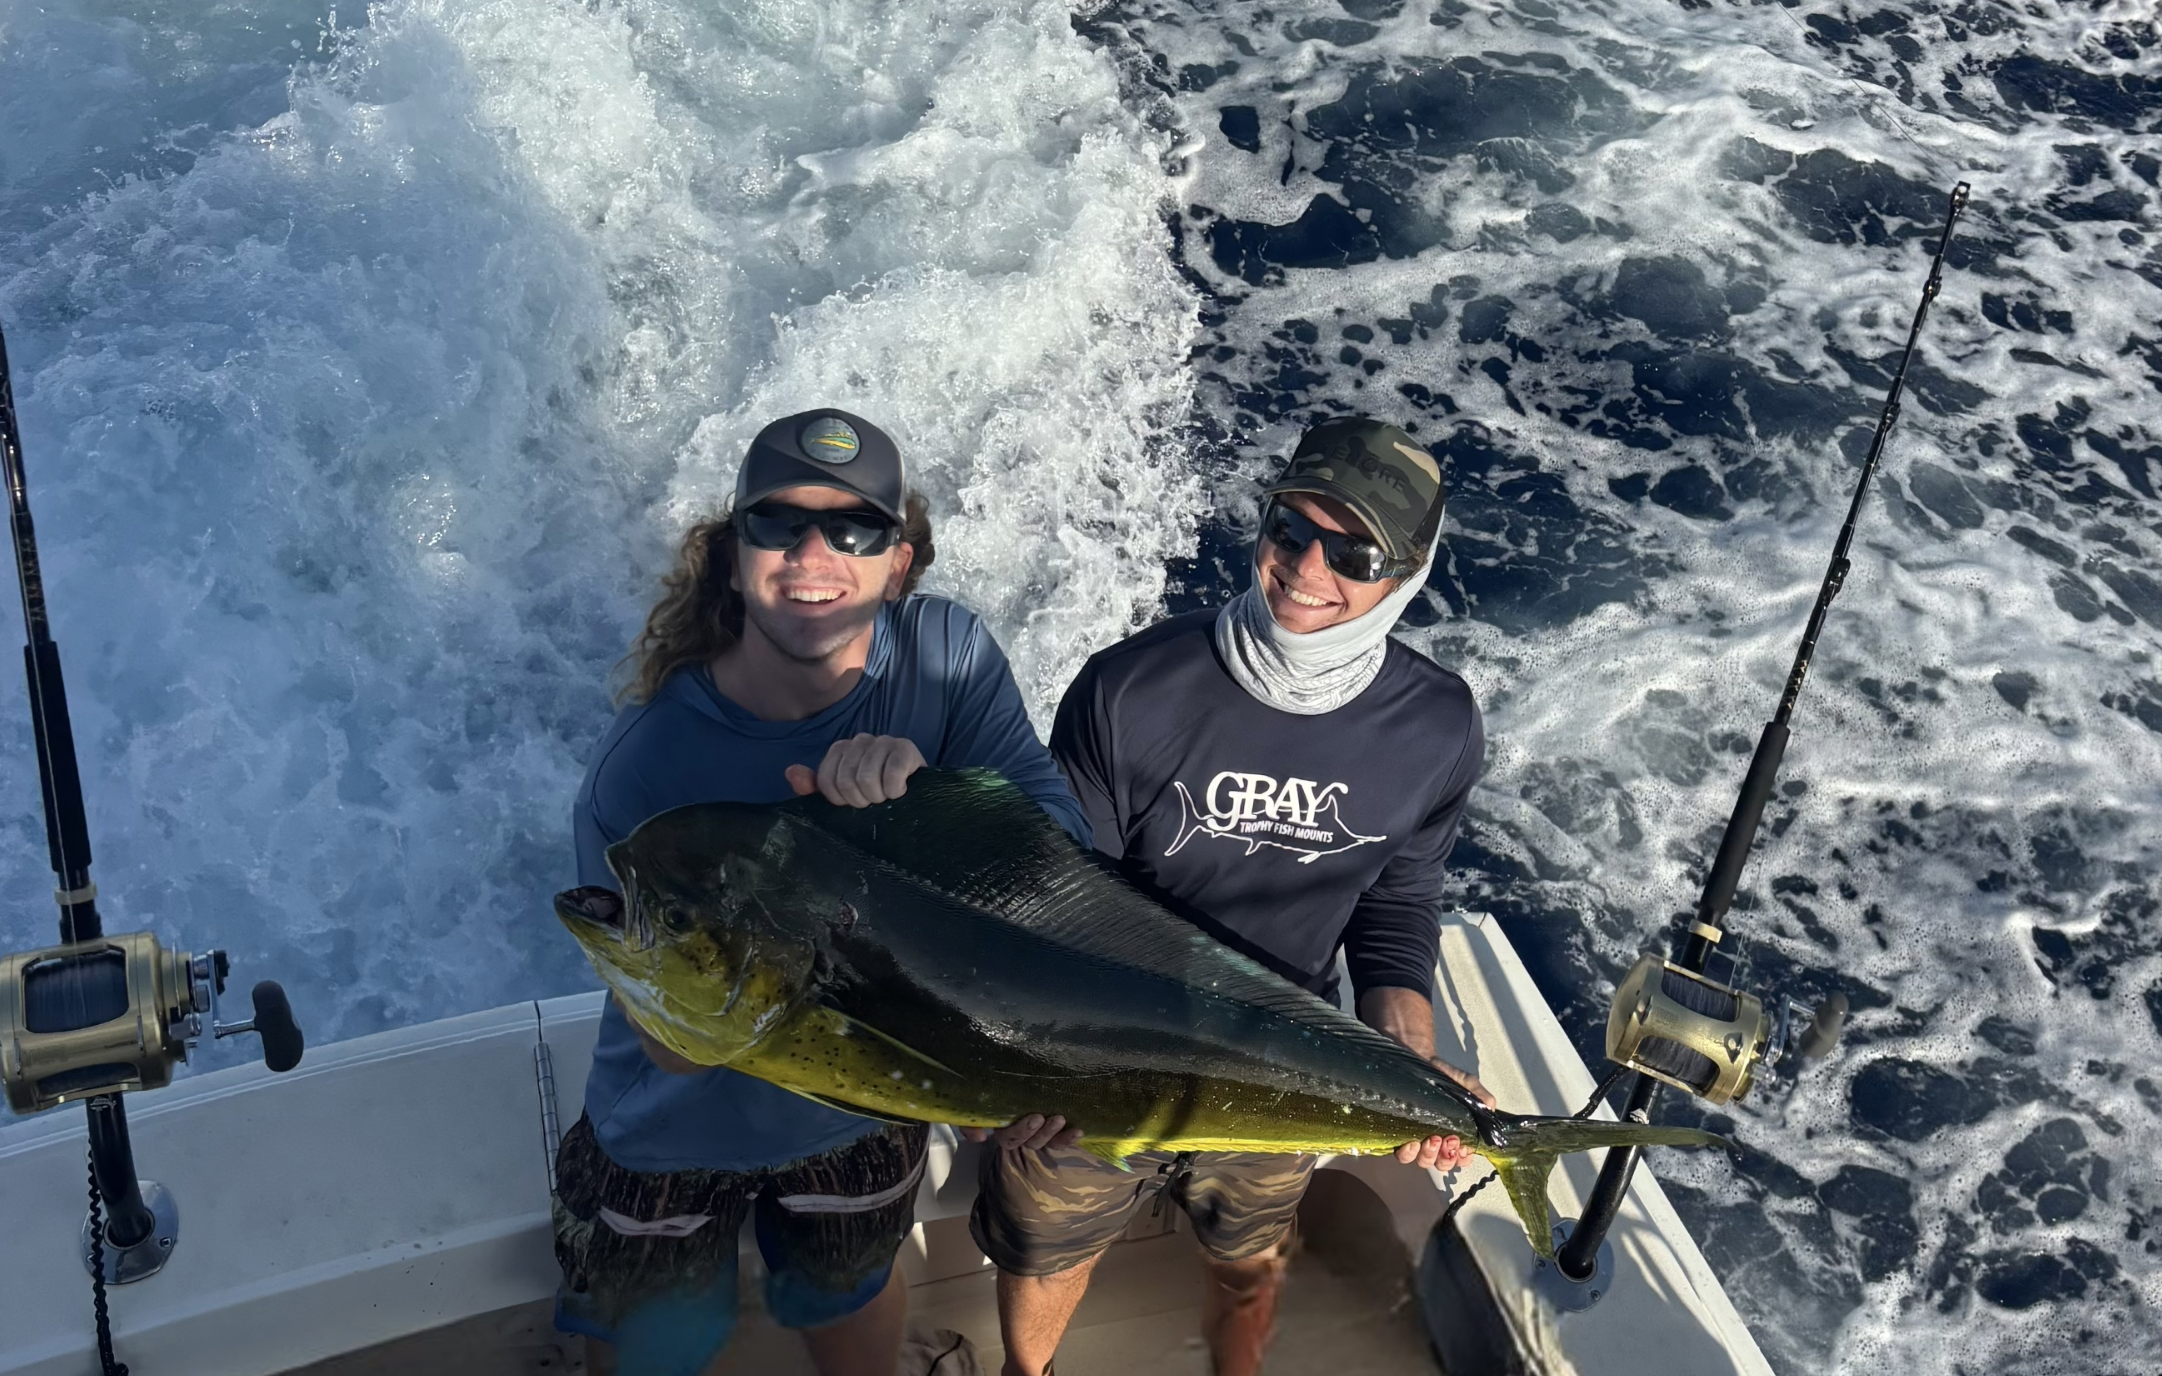
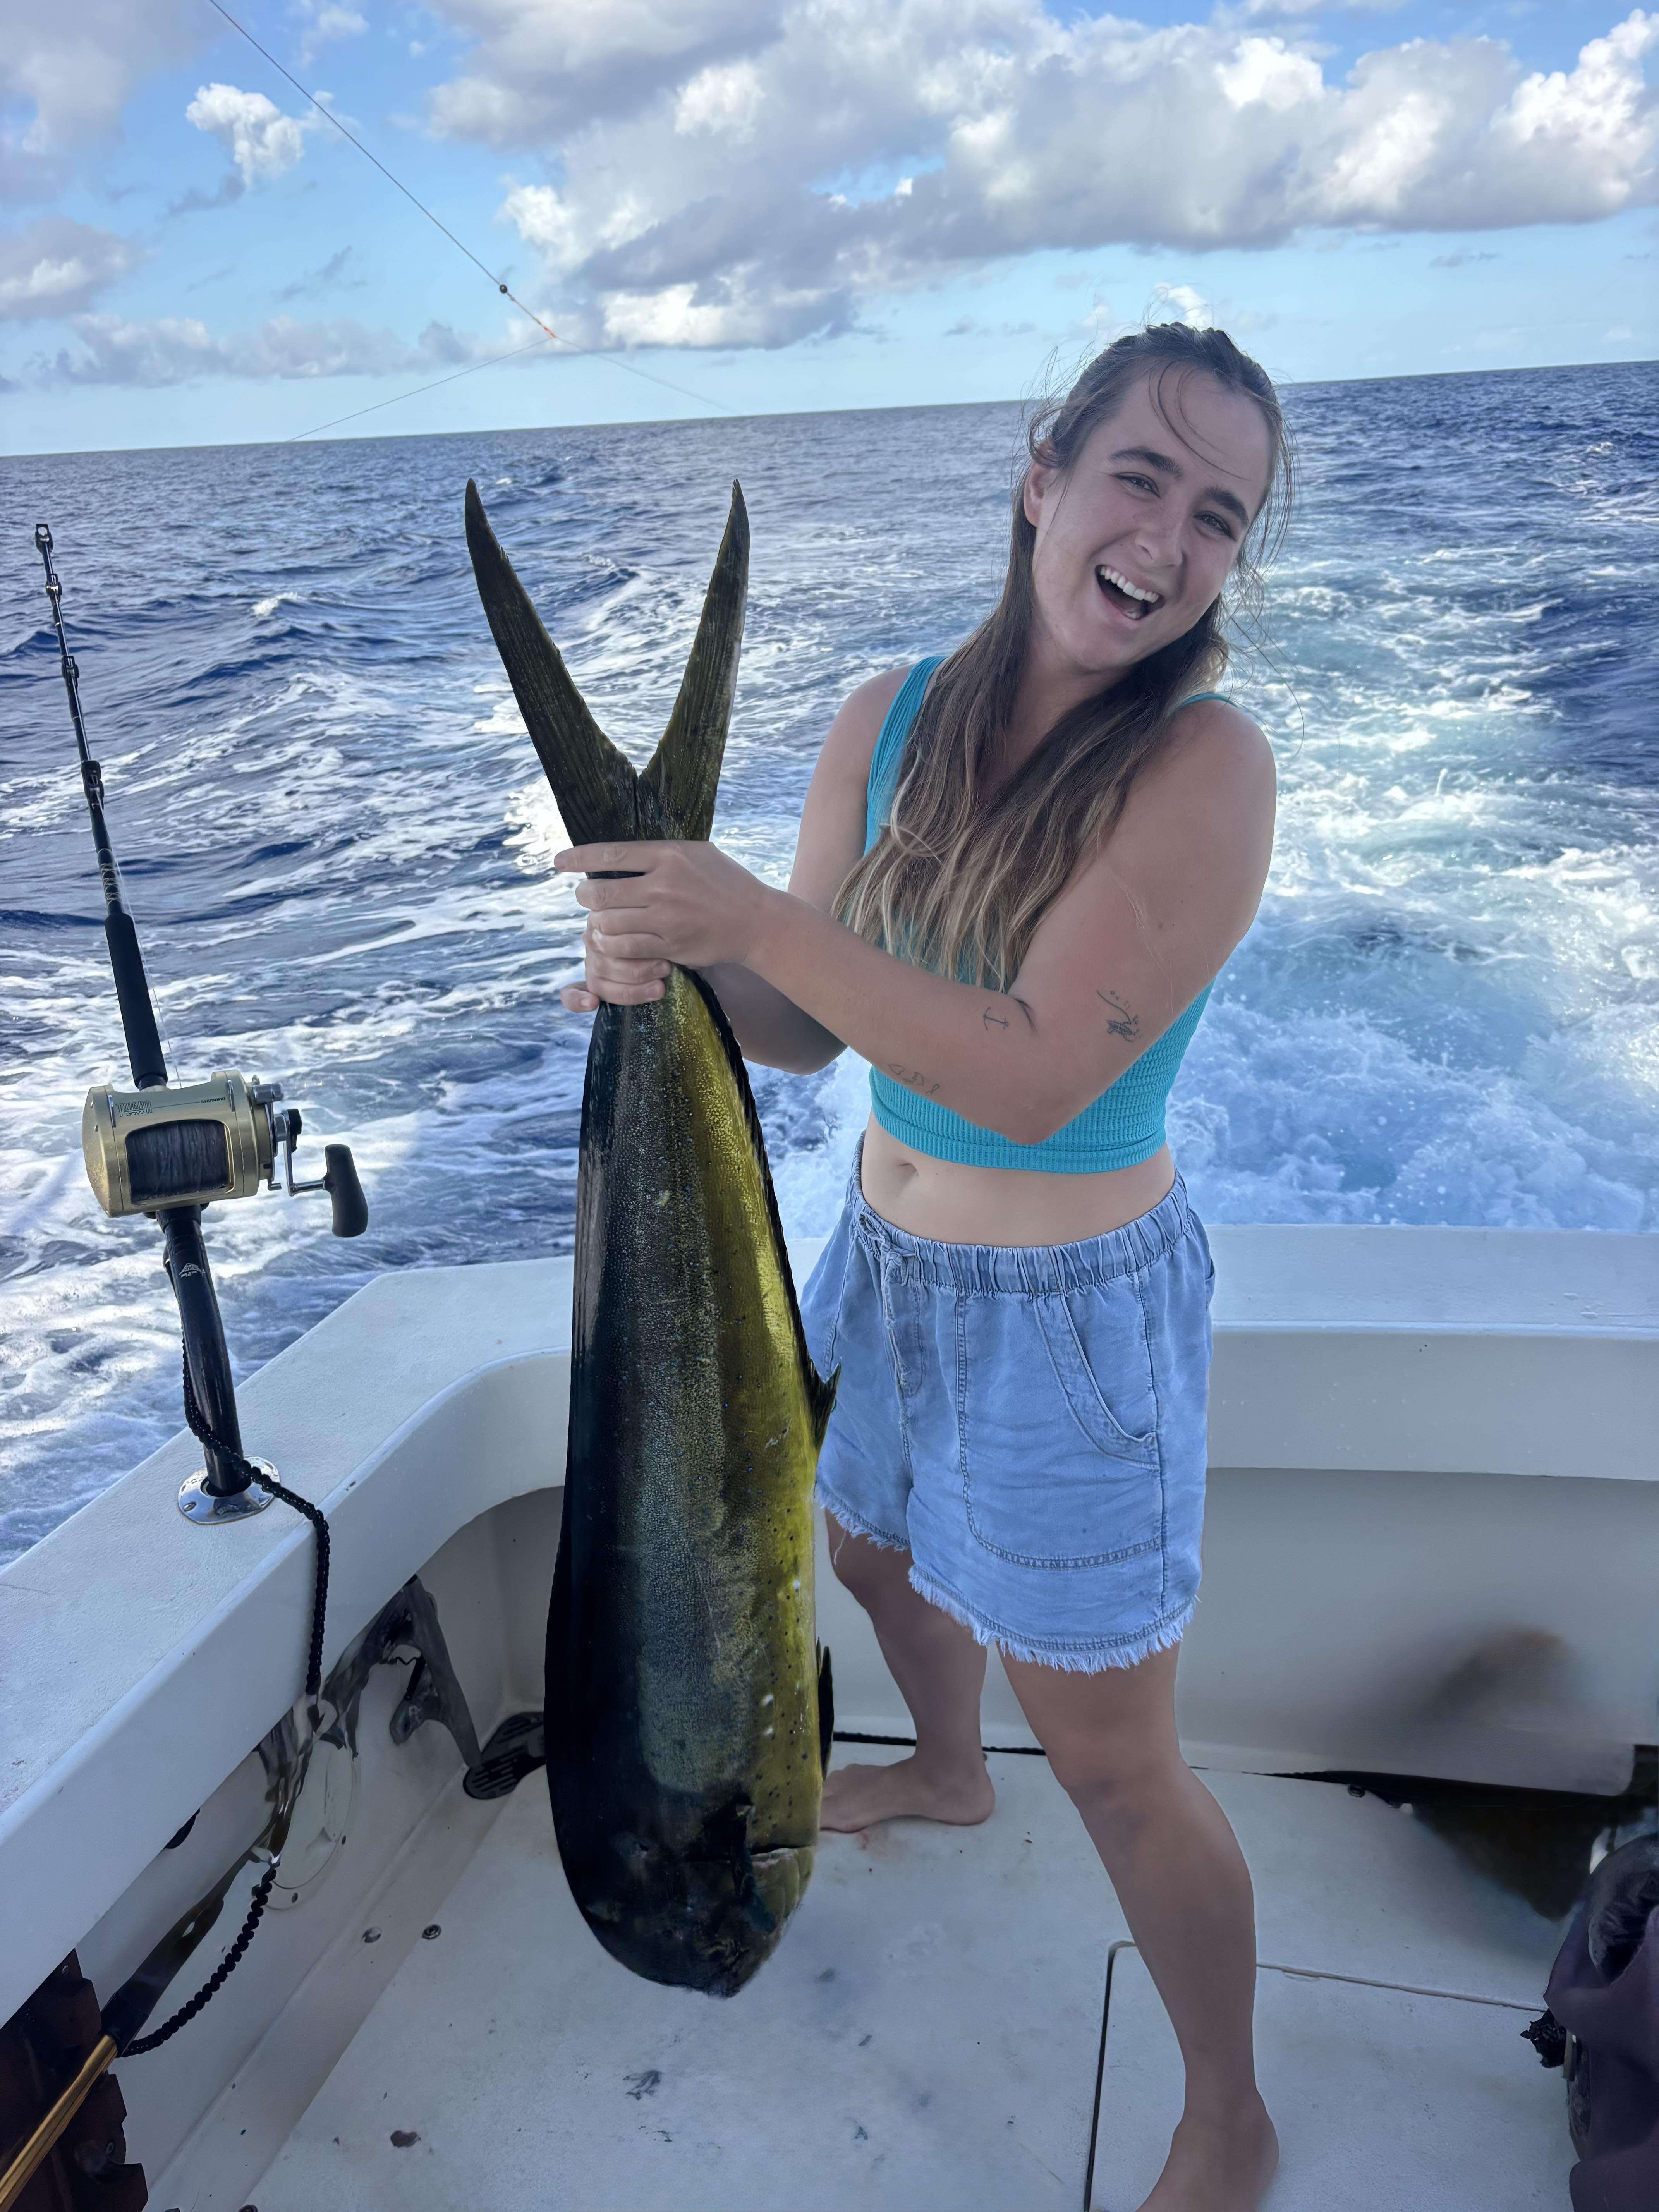
Deep Sea Fishing in Kailua-Kona
Full Day Charter 8 Hours
River, Lake Fishing in Columbia
Crappie Trips
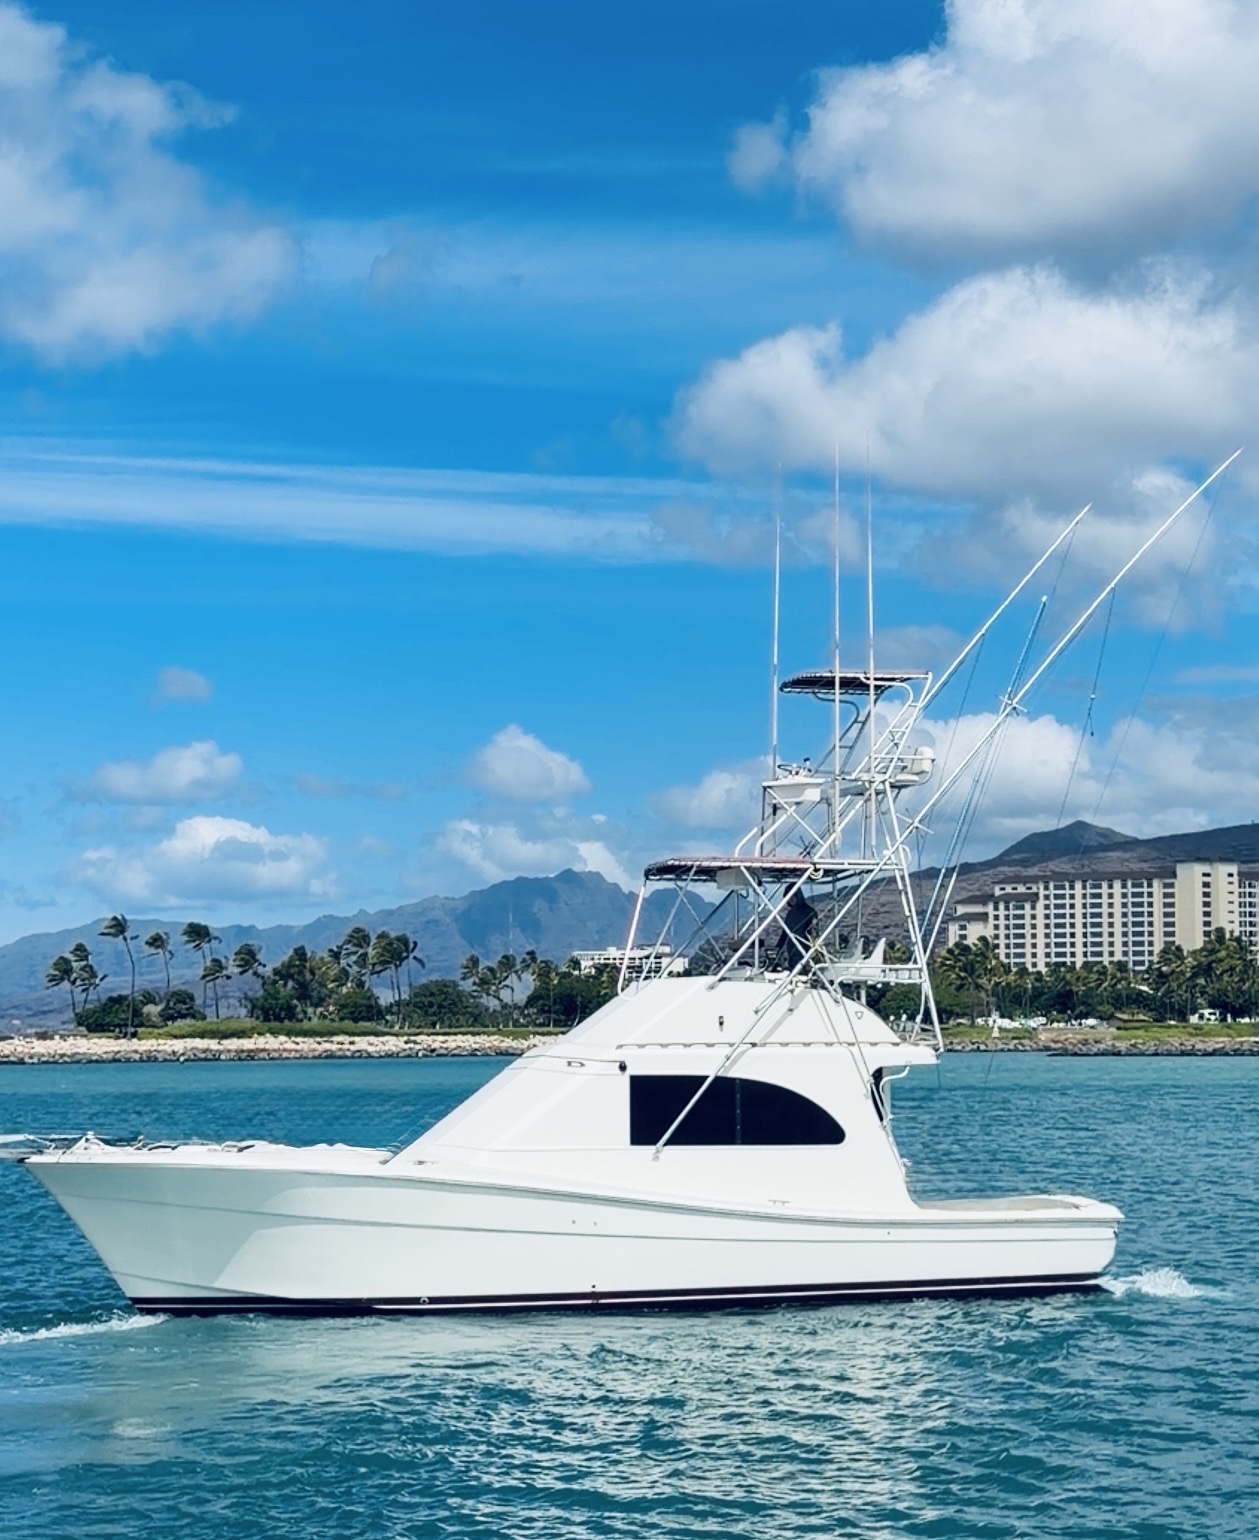
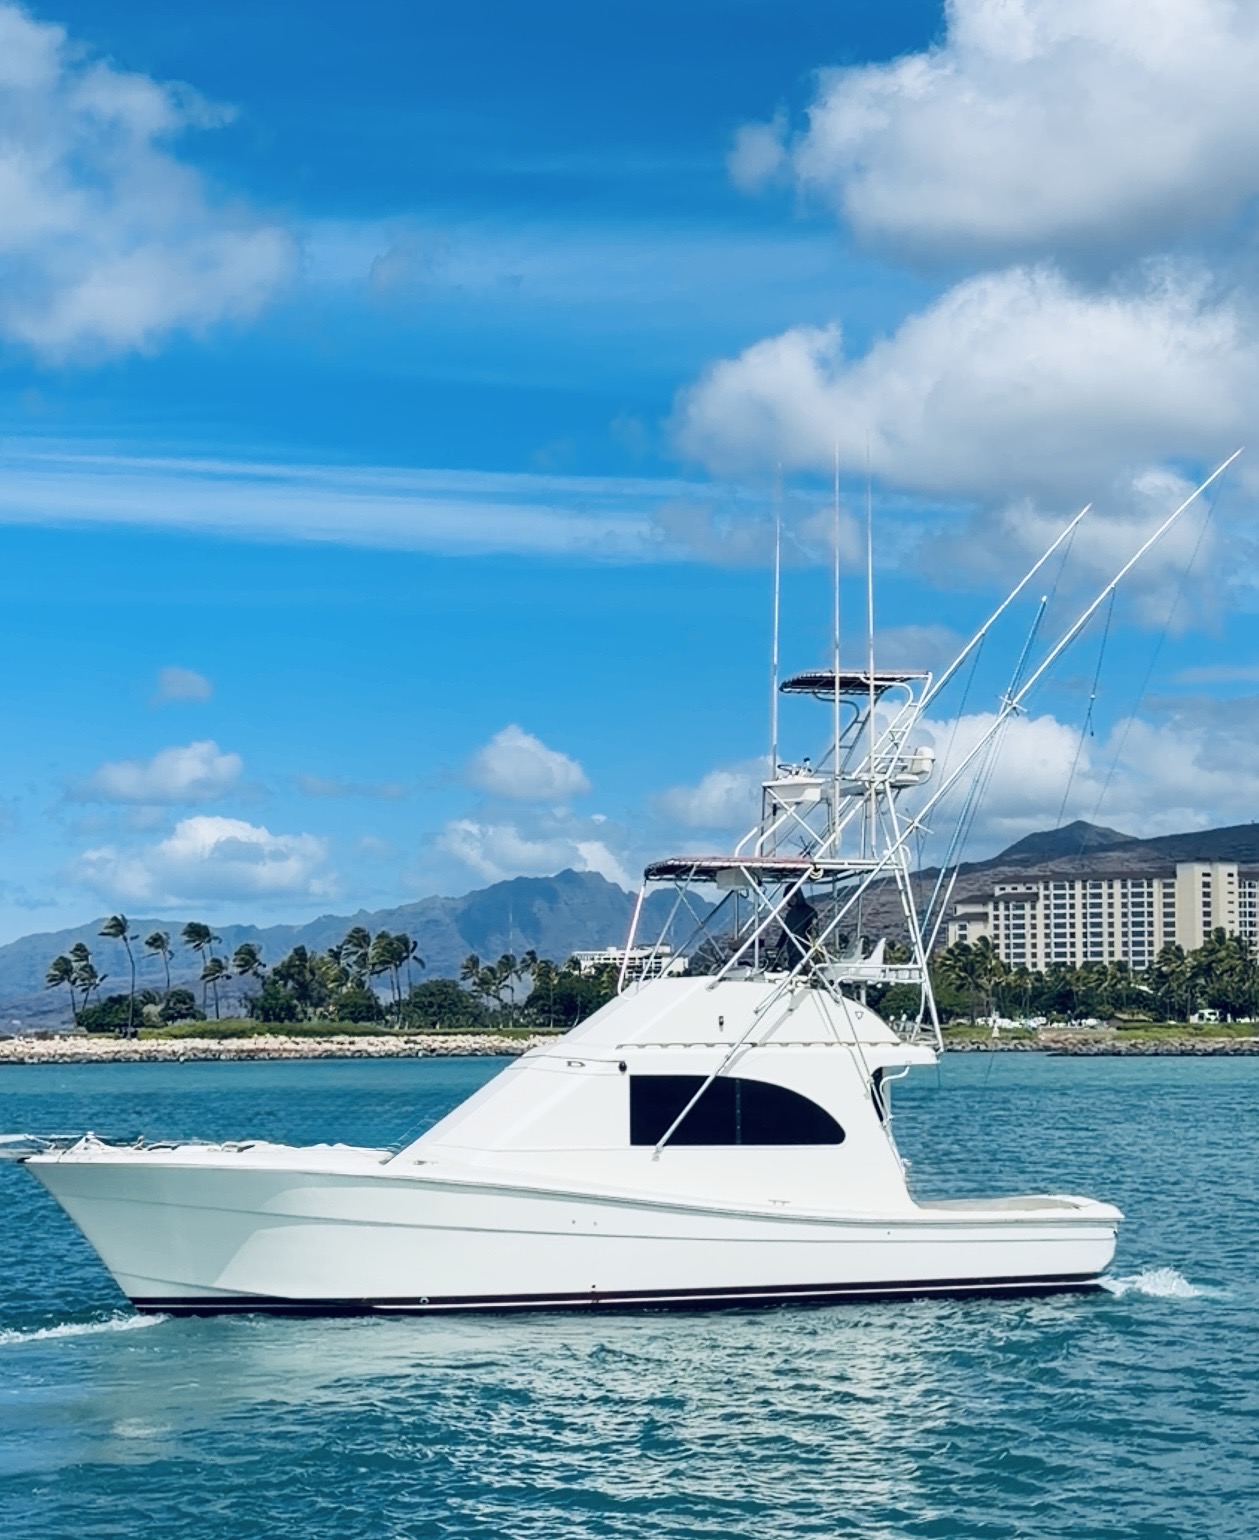
Deep Sea Fishing in Kailua-Kona
Half Day Charter 4 Hours
Dolphin Watching, Booze Cruise, Sunset Cruise in Biloxi
Custom Tours And Cruises!!
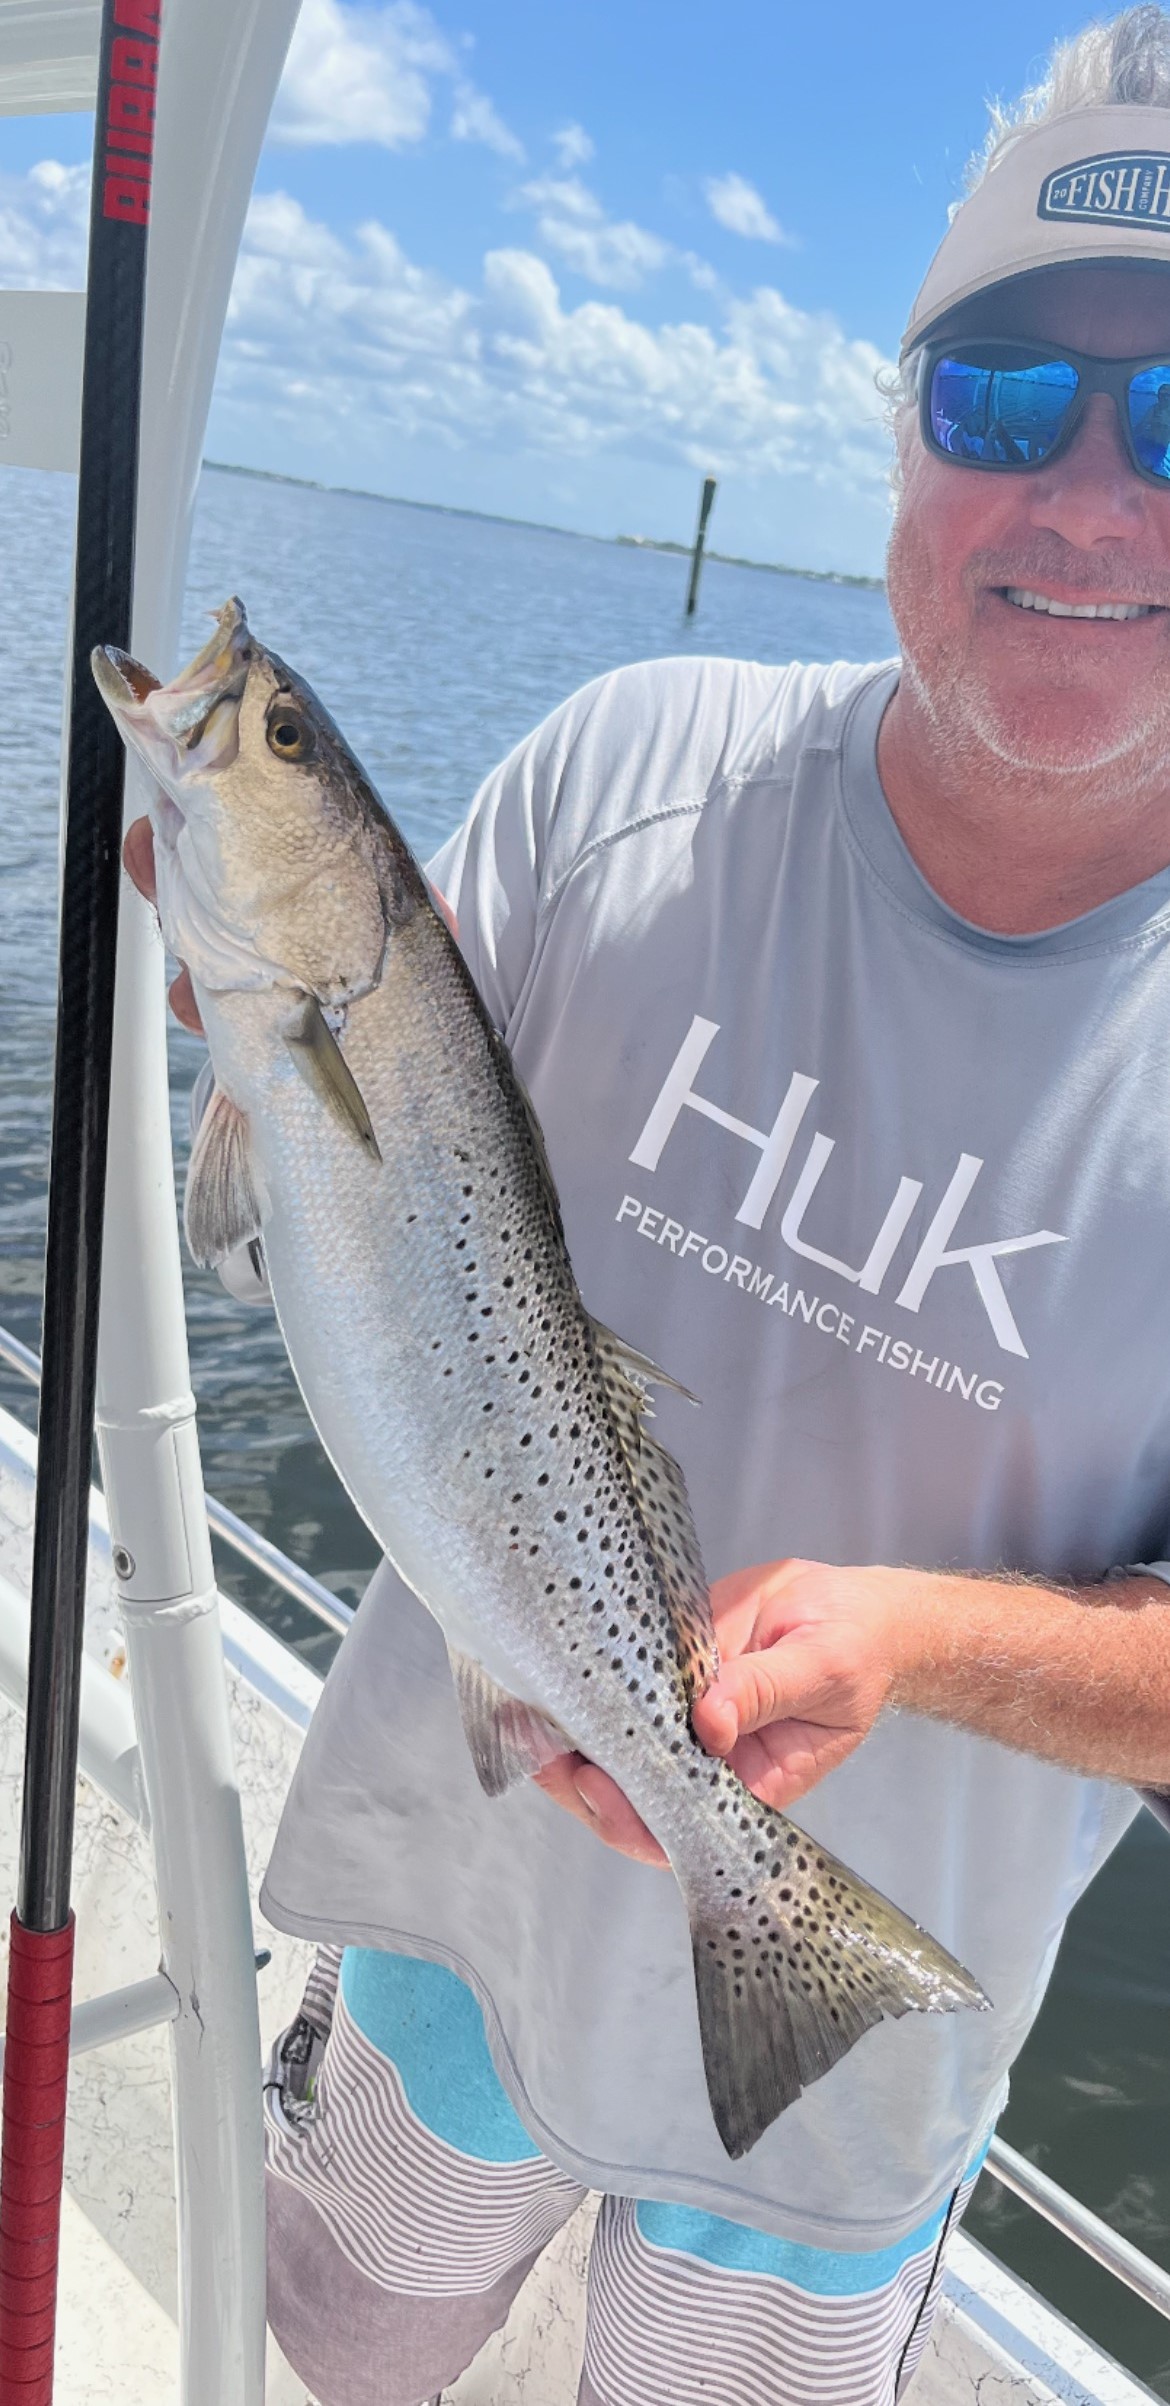
Winter Speckled Trout
Inshore, Nearshore, Flats in Biloxi
Inshore/Nearshore Fishing Charters!
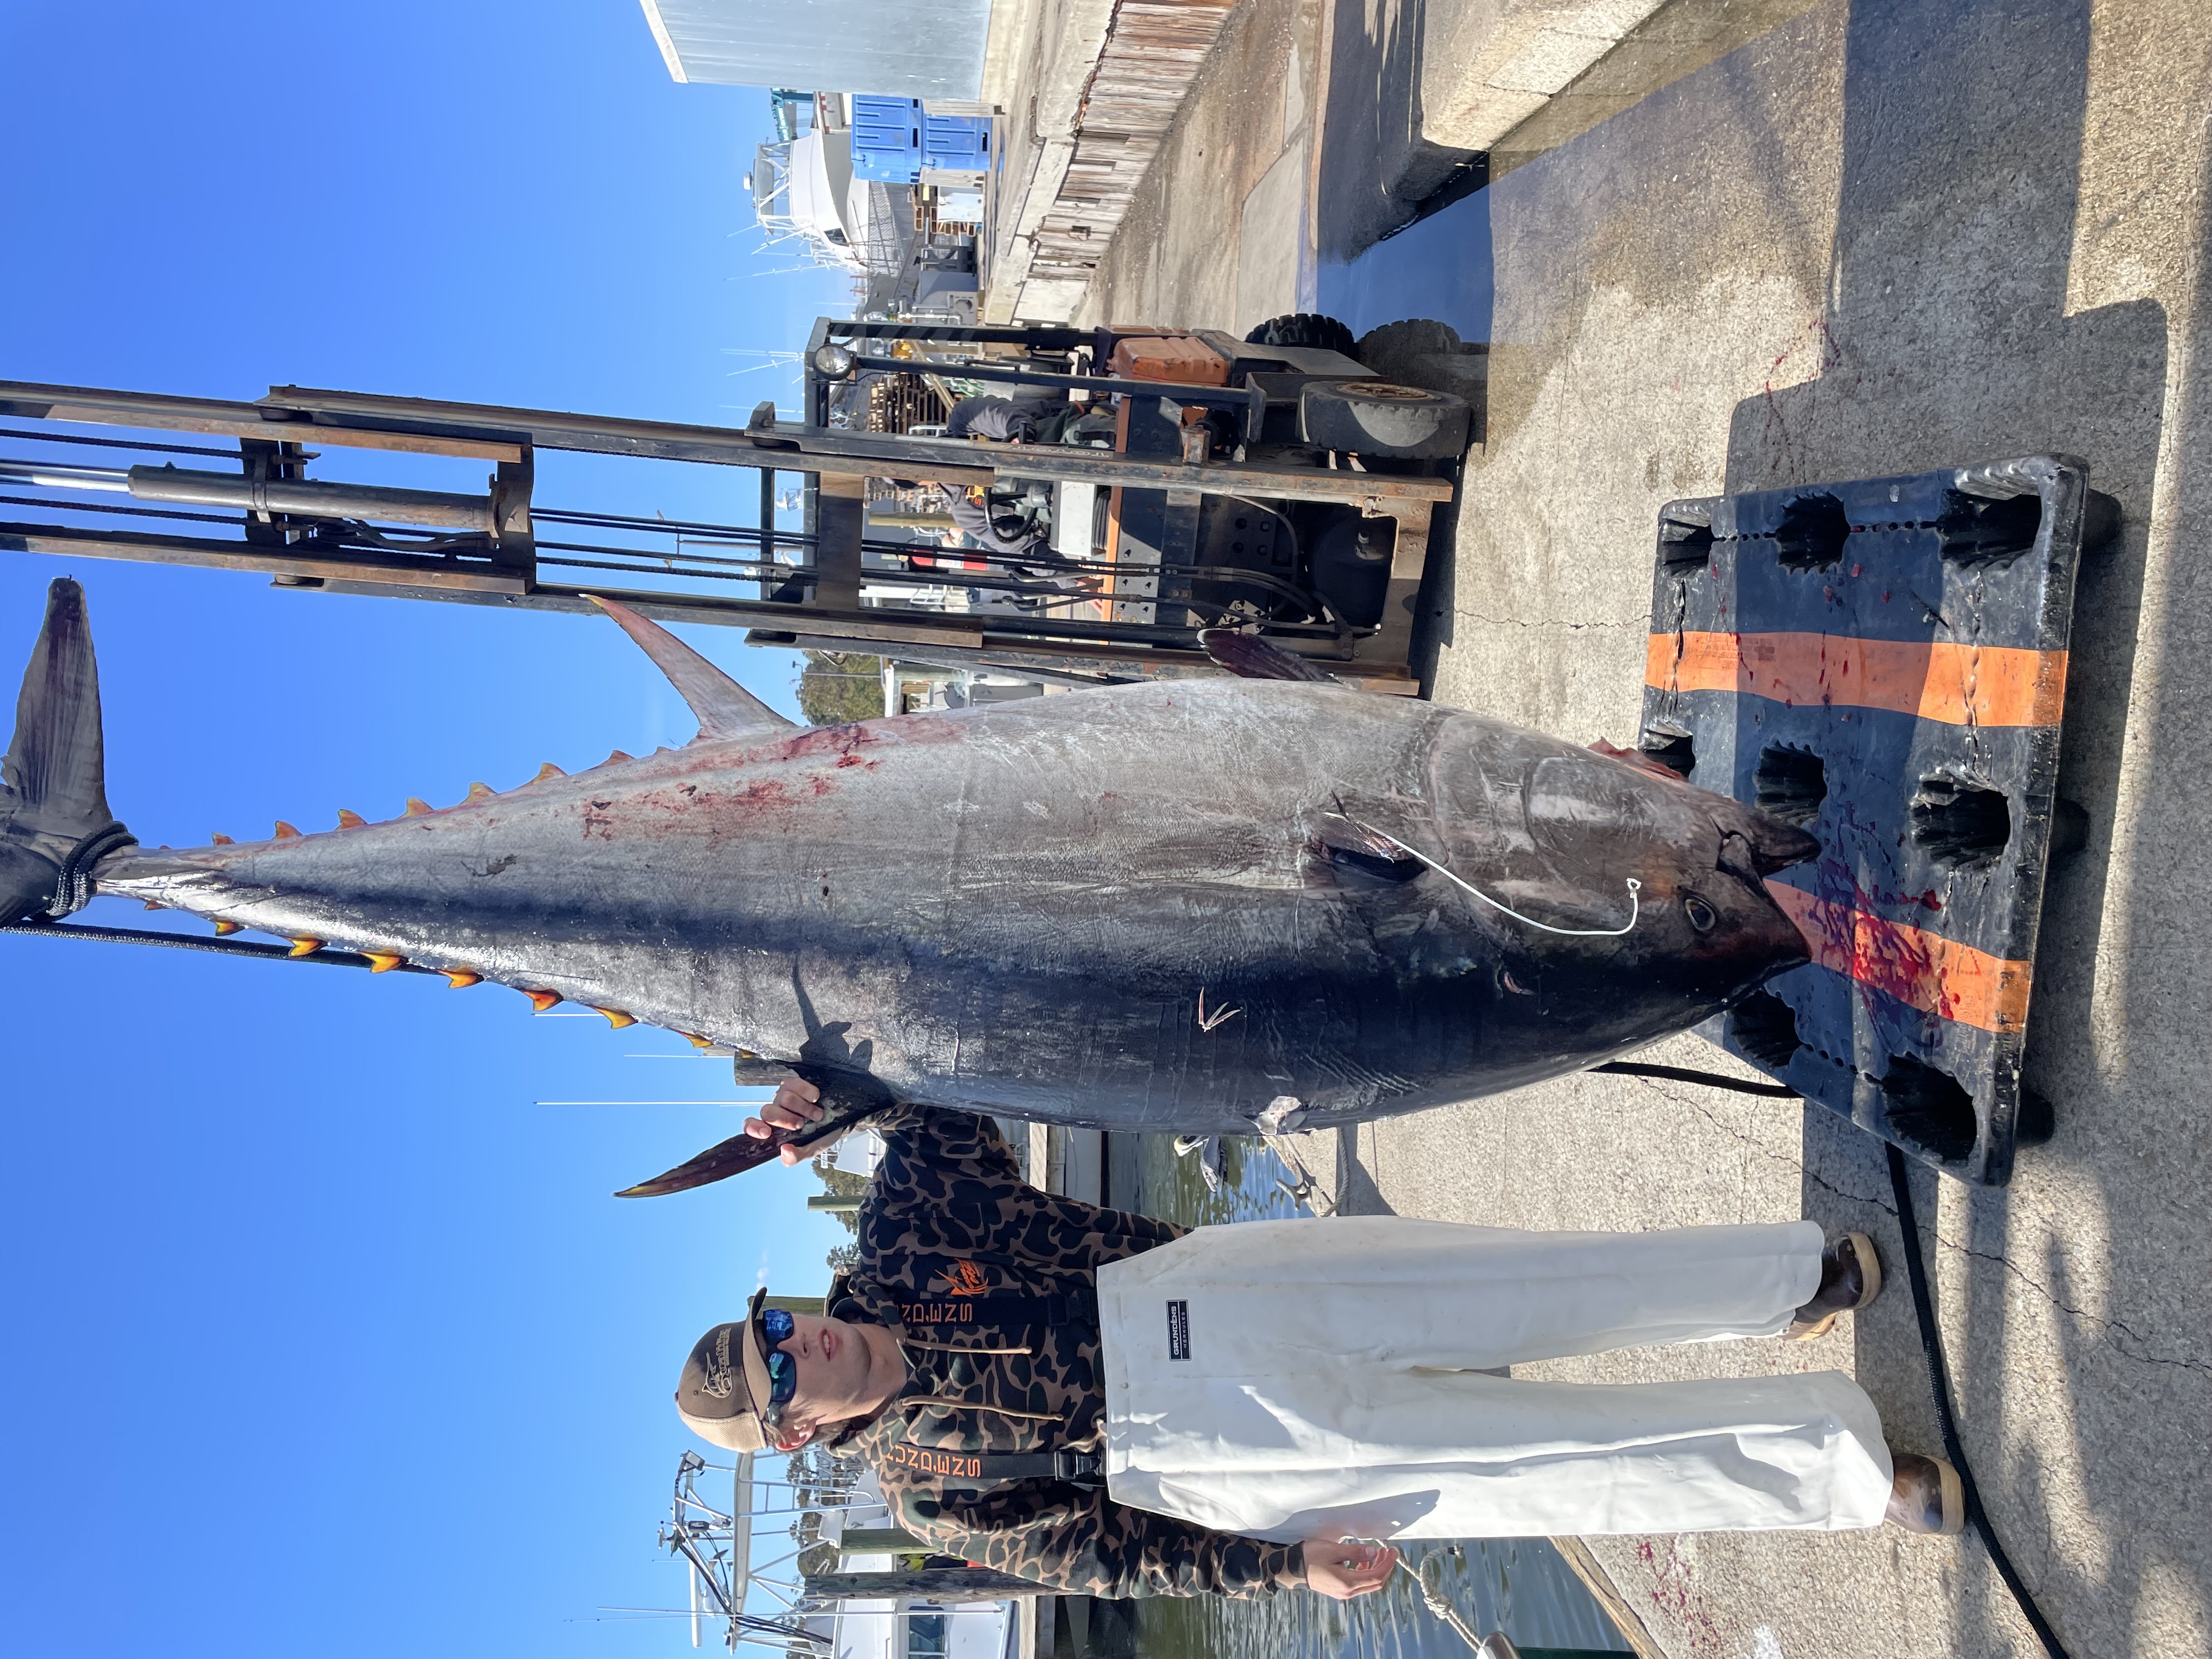
Bluefin Tuna
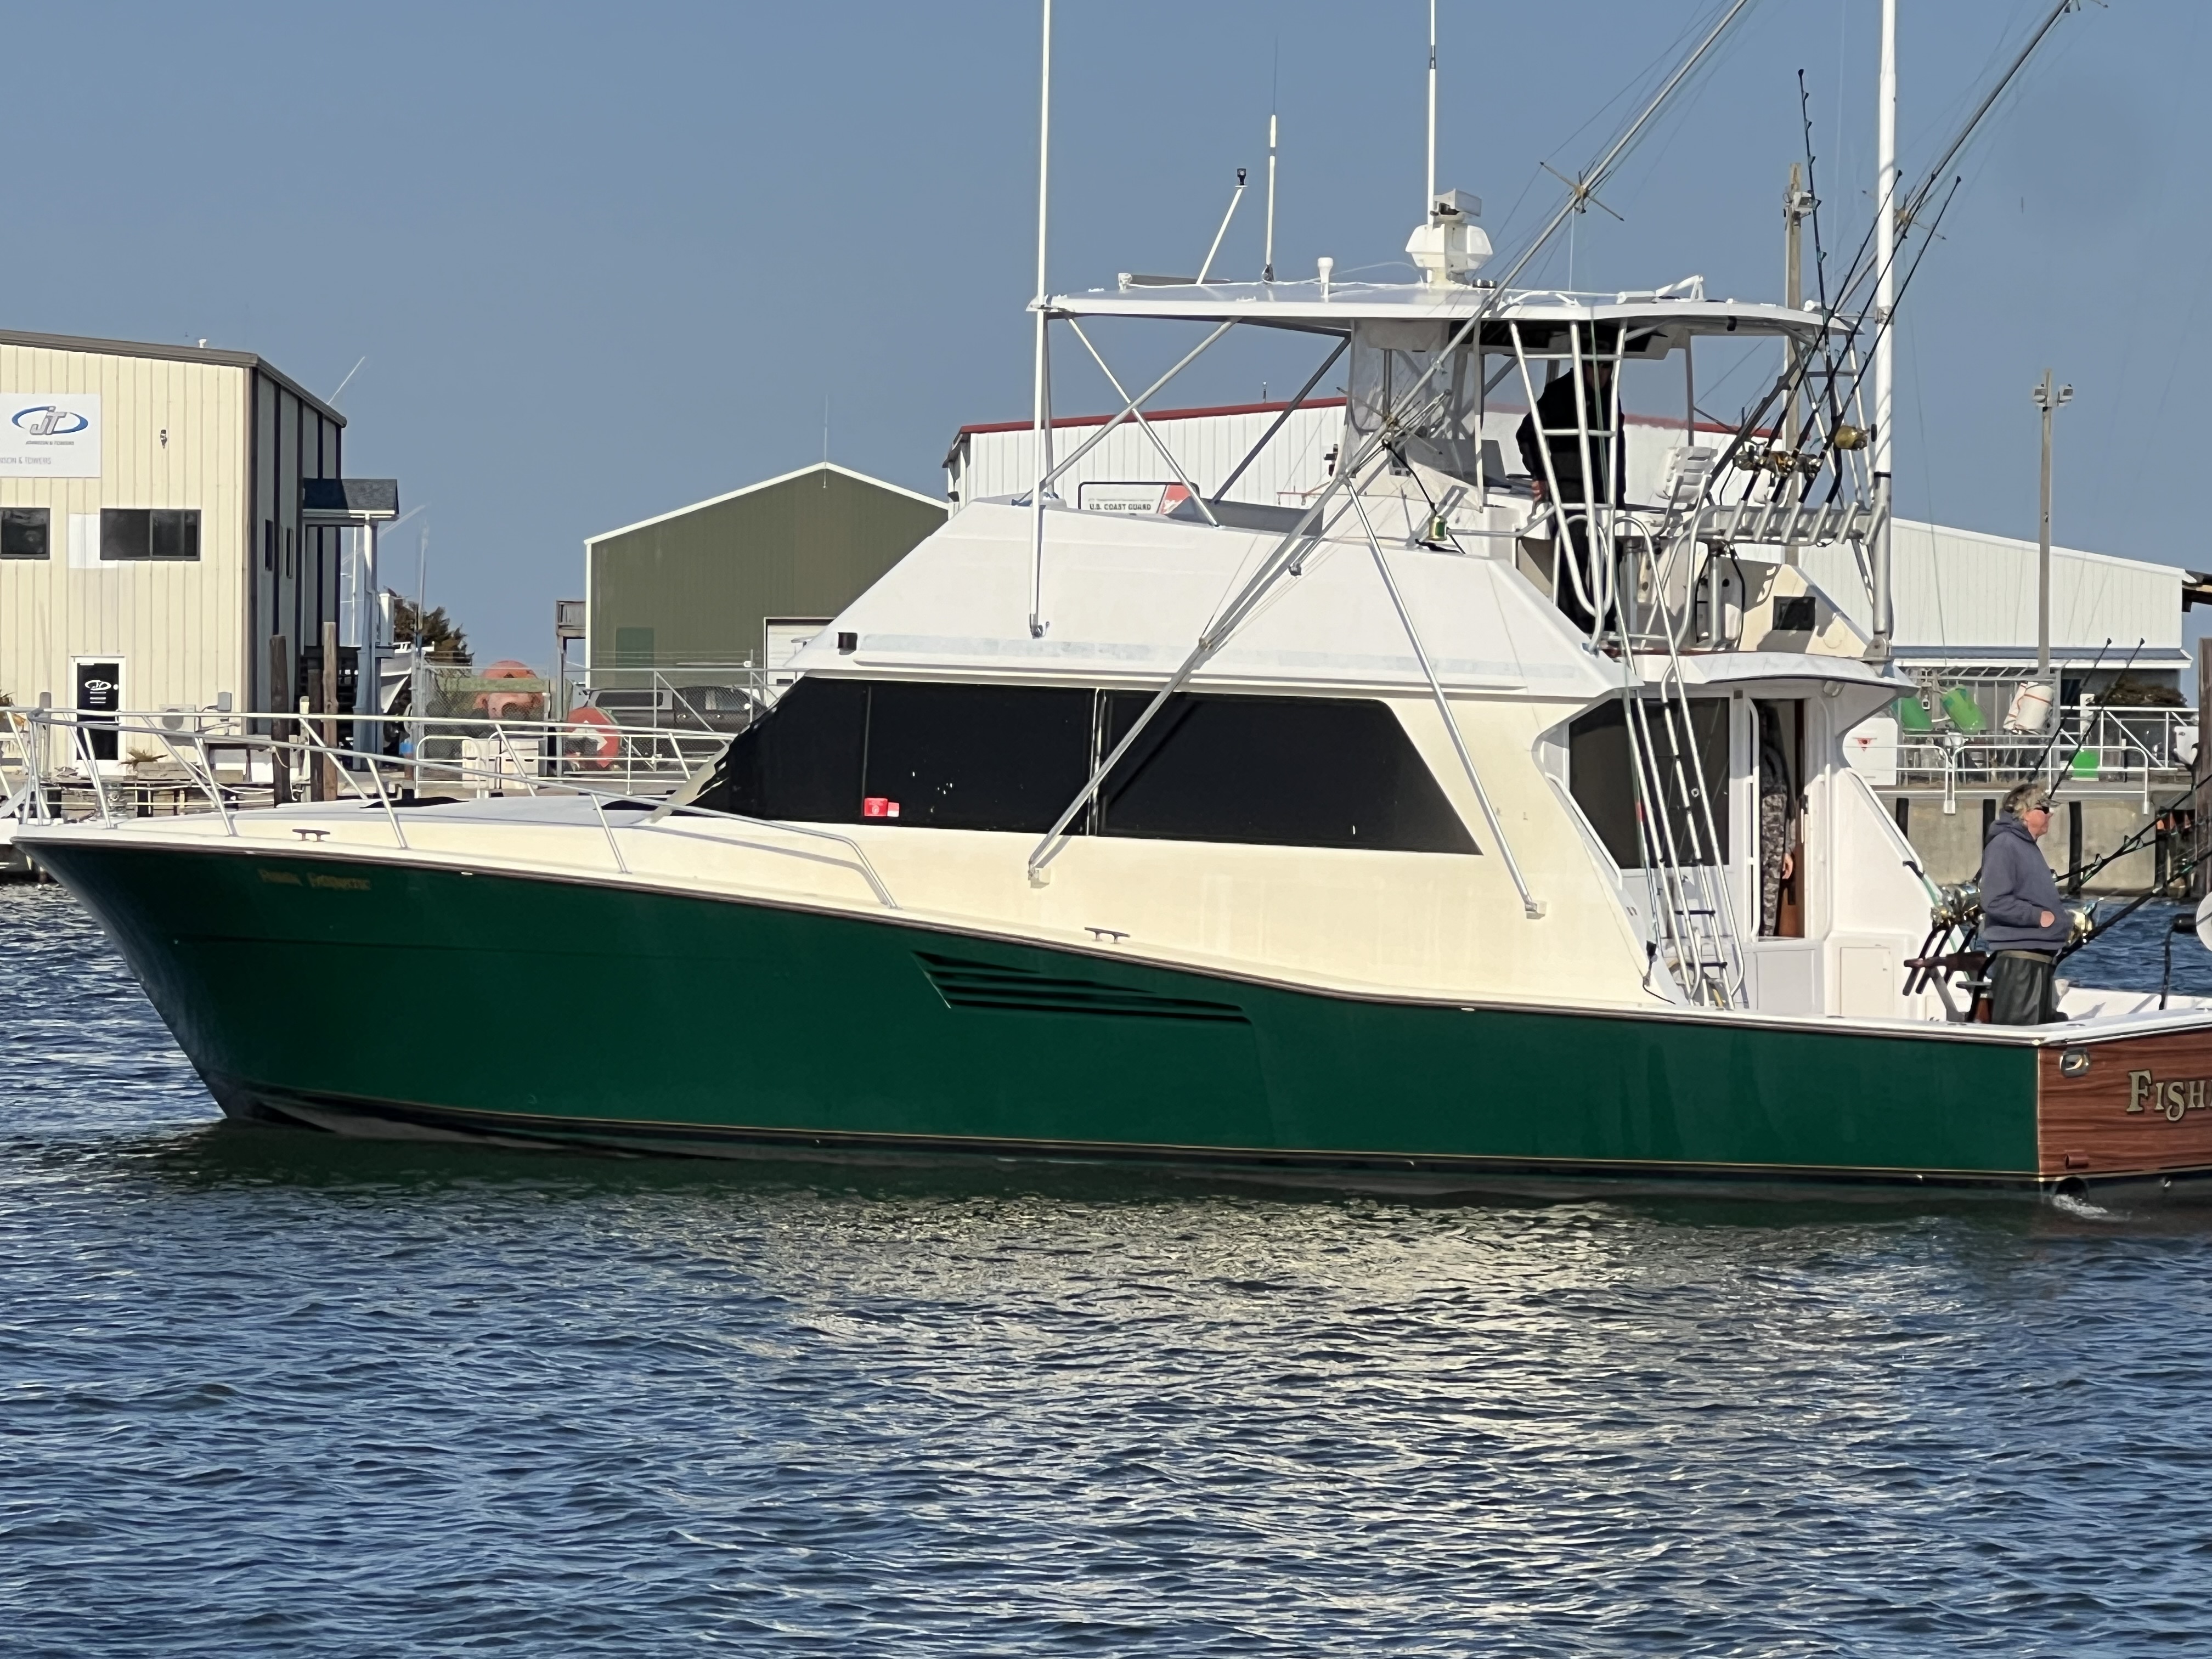
Inshore Fishing in Atlantic Beach
Inshore Fishing
River Fishing in Milton-Freewater
Columbia Basin Guided Trips
We started Captain Experiences to make it easy to book fishing and hunting guides around the world. With over 2,000 Damn Good Guides, our platform makes finding and booking a trip seamless. Head here to check out our trips.
After a tumultuous year marked by high interest rates, inflation, and multiple rounds of layoffs, many economists had pessimistic forecasts for 2023, some all but guaranteeing a recession. Despite interest rates reaching a 22-year high at the end of 2023, the U.S. economy defied expectations and continued to grow. According to the Bureau of Economic Analysis, consumer spending was a significant factor driving economic growth, reporting a 4.2% increase in disposable income in the U.S. in the fourth quarter of 2023.
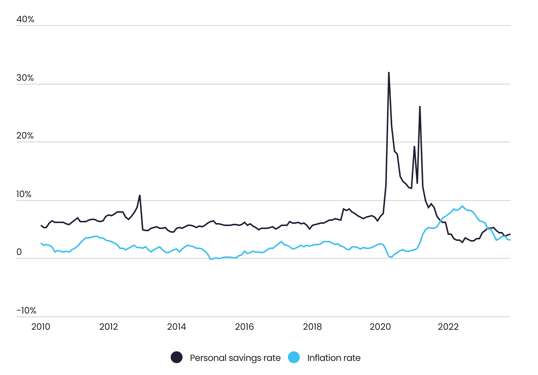
While retail spending continues to show strength, rising costs are beginning to take their toll. Although disposable income—or the income remaining after taxes—showed an overall increase in 2023, the personal savings rate—or the percentage of disposable income saved—decreased overall, indicating that Americans are spending more and saving less.
Change in the Personal Savings Rate and Inflation Rate Over Time
The personal savings dropped below historic norms as inflation remains persistently elevated
Source: Captain Experiences analysis of data from the Bureau of Economic Analysis and U.S. Bureau of Labor Statistics | Image Credit: Captain Experiences
Personal savings reached record highs during the early months of the COVID-19 pandemic, as Americans curbed spending while government programs provided additional financial support. However, as the economy reopened, a combination of pent-up consumer demand, supply chain issues, and labor shortages sent prices soaring. As Americans struggled to keep pace with rising costs, personal savings dropped sharply. Between April of 2020 and June of 2022, the personal savings rate dropped by more than 29 percentage points to a low of just 2.7%.
While rapidly rising interest rates have since helped tamp down inflation, personal savings still haven’t rebounded to pre-pandemic levels, highlighting the long-lasting impact of inflated costs and current spending habits.
Self-Estimated Minimum Family Income Requirement Changes Over Time
After inflation set in, the American perception of affordability has shifted

Source: Captain Experiences analysis of Gallup Poll Social Series data | Image Credit: Captain Experiences
Despite a strong job market and low unemployment rate, Americans are still struggling to keep up with the rising cost of living. In the past decade, Americans’ opinions around affordability have changed dramatically, with many feeling like they need to earn significantly more than previous years to live comfortably. In 2013, more than two-thirds of Americans estimated they could support a family of four with an annual household income of $75,000 or less. By 2023, less than half of Americans agreed. In fact, 30% of Americans estimate $100,000 to be the minimum income requirement to comfortably raise a family of four in 2023, compared to just 10% in 2013.
AFFORDABLE FISHING CHARTERS We currently offer more than 160 different fishing charters in Alabama, highlighted by some very popular trips in Orange Beach, Gulf Shores and Dauphin Island. Be sure to check out our complete fishing charters in Alabama guide, where you will find an Alabama fishing calendar, reviews from all of our offerings, and your next affordable fishing trip in Alabama.
Changes in Household Spending From a Year Ago
While households increased their spending on recreation and health from last year, they cut back on dining out and foreign travel

Source: Captain Experiences analysis of Gallup Poll Social Series data | Image Credit: Captain Experiences
As disposable income and personal savings rates changed in the U.S., so did household spending habits. Priorities shifted, with foreign travel and dining out taking a backseat to spending on recreational activities and health. Compared to a year ago, spending on recreation increased 5.9% in Q3 2023, while health spending increased by 5.4% when adjusted for inflation. In the same timeframe, spending on foreign travel decreased by 7.6%, while expenses reserved for dining out decreased 0.4%. Along with recreation and health, spending on transportation also rose by 3.1%.
In the U.S., disposable income varies geographically. Since many factors like the local cost of living and interest rates can affect an individual’s disposable income, residents in certain parts of the country fare better than others. Many states in the Great Plains region—known for a lower cost of living than average—have high levels of disposable income. Five out of the top six states are located in this region, led by North Dakota with a cost-of-living adjusted, after-tax income of $71,444 per capita. On the other hand, Hawaii ranks last with an adjusted after-tax income per capita of only $47,894. Select areas of the Deep South, like Mississippi and Georgia, also have some of the lowest levels of disposable income in the country.
Below is a complete breakdown of the areas with the least disposable income across all 50 states. The analysis was conducted by researchers at Captain Experiences using data from the Bureau of Economic Analysis. For more information on how each statistic was computed, refer to the methodology section below.
States With the Least Disposable Income

Photo Credit: Andrew Zarivny / Shutterstock
15. Utah
- After-tax income per capita (adjusted): $53,990
- After-tax income per capita: $51,005
- Before-tax income per capita: $59,457
- Personal taxes paid per capita: $8,452
- Cost of living (compared to average): -5.5%

Photo Credit: John Couture / Shutterstock
14. North Carolina
- After-tax income per capita (adjusted): $53,756
- After-tax income per capita: $50,640
- Before-tax income per capita: $58,109
- Personal taxes paid per capita: $7,469
- Cost of living (compared to average): -5.8%

Photo Credit: Henryk Sadura / Shutterstock
13. Michigan
- After-tax income per capita (adjusted): $53,187
- After-tax income per capita: $49,692
- Before-tax income per capita: $57,038
- Personal taxes paid per capita: $7,346
- Cost of living (compared to average): -6.6%

Photo Credit: Wangkun Jia / Shutterstock
12. Maine
- After-tax income per capita (adjusted): $52,570
- After-tax income per capita: $53,011
- Before-tax income per capita: $60,599
- Personal taxes paid per capita: $7,588
- Cost of living (compared to average): +0.8%

Photo Credit: Sean Pavone / Shutterstock
11. Rhode Island
- After-tax income per capita (adjusted): $52,237
- After-tax income per capita: $54,692
- Before-tax income per capita: $63,557
- Personal taxes paid per capita: $8,865
- Cost of living (compared to average): +4.7%

Photo Credit: Turtix / Shutterstock
10. New Mexico
- After-tax income per capita (adjusted): $51,960
- After-tax income per capita: $47,274
- Before-tax income per capita: $52,194
- Personal taxes paid per capita: $4,920
- Cost of living (compared to average): -9.0%

Photo Credit: Sean Pavone / Shutterstock
9. Alabama
- After-tax income per capita (adjusted): $51,549
- After-tax income per capita: $45,248
- Before-tax income per capita: $50,916
- Personal taxes paid per capita: $5,668
- Cost of living (compared to average): -12.2%

Photo Credit: Harold Stiver / Shutterstock
8. Kentucky
- After-tax income per capita (adjusted): $51,347
- After-tax income per capita: $45,882
- Before-tax income per capita: $51,921
- Personal taxes paid per capita: $6,039
- Cost of living (compared to average): -10.6%

Photo Credit: Andrew Zarivny / Shutterstock
7. Arizona
- After-tax income per capita (adjusted): $51,301
- After-tax income per capita: $51,248
- Before-tax income per capita: $58,442
- Personal taxes paid per capita: $7,194
- Cost of living (compared to average): -0.1%

Photo Credit: f11photo / Shutterstock
6. Georgia
- After-tax income per capita (adjusted): $51,048
- After-tax income per capita: $48,920
- Before-tax income per capita: $56,589
- Personal taxes paid per capita: $7,669
- Cost of living (compared to average): -4.2%

Photo Credit: Sean Pavone / Shutterstock
5. West Virginia
- After-tax income per capita (adjusted): $50,489
- After-tax income per capita: $45,059
- Before-tax income per capita: $49,993
- Personal taxes paid per capita: $4,934
- Cost of living (compared to average): -10.8%

Photo Credit: Sean Pavone / Shutterstock
4. South Carolina
- After-tax income per capita (adjusted): $50,302
- After-tax income per capita: $47,058
- Before-tax income per capita: $53,618
- Personal taxes paid per capita: $6,560
- Cost of living (compared to average): -6.4%
LEARN MORE Our fishing guides in South Carolina are rated a 4.82 out of 5 based on 9,750 verified reviews. Find an affordable trip among our 80 unique fishing charters in South Carolina today.

Photo Credit: Andrew Zarivny / Shutterstock
3. Oregon
- After-tax income per capita (adjusted): $49,809
- After-tax income per capita: $53,079
- Before-tax income per capita: $62,303
- Personal taxes paid per capita: $9,224
- Cost of living (compared to average): +6.6%

Photo Credit: Sean Pavone / Shutterstock
2. Mississippi
- After-tax income per capita (adjusted): $48,289
- After-tax income per capita: $42,170
- Before-tax income per capita: $46,370
- Personal taxes paid per capita: $4,200
- Cost of living (compared to average): -12.7%
RELATED You don’t need to break the bank to enjoy a professionally guided fishing charter in Mississippi, where we currently offer highly-rated experiences for as low as $250 per person.
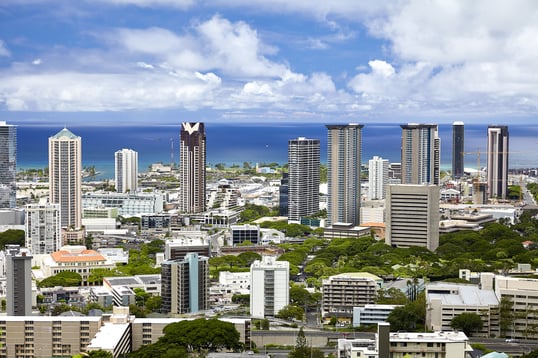
Photo Credit: Ja-images / Shutterstock
1. Hawaii
- After-tax income per capita (adjusted): $47,894
- After-tax income per capita: $53,085
- Before-tax income per capita: $61,779
- Personal taxes paid per capita: $8,694
- Cost of living (compared to average): +10.8%
Methodology
To find the locations with the least disposable income, researchers at Captain Experiences analyzed the latest data from the Bureau of Economic Analysis’ Regional Economic Accounts. The researchers ranked states according to the per capita after-tax income after adjusting for the cost of living. For additional context, the unadjusted per capita after-tax income, per capita before-tax income, per capita personal taxes paid, and cost of living were also calculated.
References
-
Federal Reserve Bank of St. Louis. (2024, January 2). Federal Funds Effective Rate. Board of Governors of the Federal Reserve System. Retrieved January 29, 2024, from FRED
-
U.S. Bureau of Economic Analysis. (2024, January 25). Gross domestic Product, fourth quarter and year 2023 (Advance Estimate). Retrieved January 29, 2024, from BEA
-
U.S. Census Bureau. (2024, January 17). Advance Monthly Sales for Retail and Food Services, December 2023. Retrieved January 9, 2024, from Census Gov
-
Federal Reserve Bank of St. Louis. (2024, January 2). All Employees, Total Nonfarm. U.S. Bureau of Labor Statistics. Retrieved January 29, 2024, from FRED
-
Federal Reserve Bank of St. Louis. (2024, January 2). Unemployment Rate. U.S. Bureau of Labor Statistics. Retrieved January 29, 2024, from FRED
Jake Lane
Updated on February 19, 2025

April 26, 2022

January 19, 2021
November 15, 2023

May 13, 2024

November 7, 2023
Related Articles
August 17, 2023
May 13, 2024
April 18, 2024
Featured Locations
- Fishing Charters Near Me
- Austin Fishing Guides
- Biloxi Fishing Charters
- Bradenton Fishing Charters
- Cabo San Lucas Fishing Charters
- Cancun Fishing Charters
- Cape Coral Fishing Charters
- Charleston Fishing Charters
- Clearwater Fishing Charters
- Corpus Christi Fishing Charters
- Crystal River Fishing Charters
- Dauphin Island Fishing Charters
- Daytona Beach Fishing Charters
- Destin Fishing Charters
- Fort Lauderdale Fishing Charters
- Fort Myers Fishing Charters
- Fort Walton Beach Fishing Charters
- Galveston Fishing Charters
- Gulf Shores Fishing Charters
- Hatteras Fishing Charters
- Hilton Head Fishing Charters
- Islamorada Fishing Charters
- Jacksonville Fishing Charters
- Jupiter Fishing Charters
- Key Largo Fishing Charters
- Key West Fishing Charters
- Kona Fishing Charters
- Lakeside Marblehead Fishing Charters
- Marathon Fishing Charters
- Marco Island Fishing Charters
- Miami Fishing Charters
- Montauk Fishing Charters
- Morehead City Fishing Charters
- Naples Fishing Charters
- New Orleans Fishing Charters
- New Smyrna Beach Fishing Charters
- Ocean City Fishing Charters
- Orange Beach Fishing Charters
- Panama City Beach Fishing Charters
- Pensacola Fishing Charters
- Pompano Beach Fishing Charters
- Port Aransas Fishing Charters
- Port Orange Fishing Charters
- Rockport Fishing Charters
- San Diego Fishing Charters
- San Juan Fishing Charters
- Sarasota Fishing Charters
- South Padre Island Fishing Charters
- St. Augustine Fishing Charters
- St. Petersburg Fishing Charters
- Tampa Fishing Charters
- Tarpon Springs Fishing Charters
- Venice Fishing Charters
- Virginia Beach Fishing Charters
- West Palm Beach Fishing Charters
- Wilmington Fishing Charters
- Wrightsville Beach Fishing Charters

