Boat Cruise, Dolphin Watching, Snorkeling in Panama City Beach
Dolphin Tour
Inshore, Nearshore, Jetty in Panama City Beach
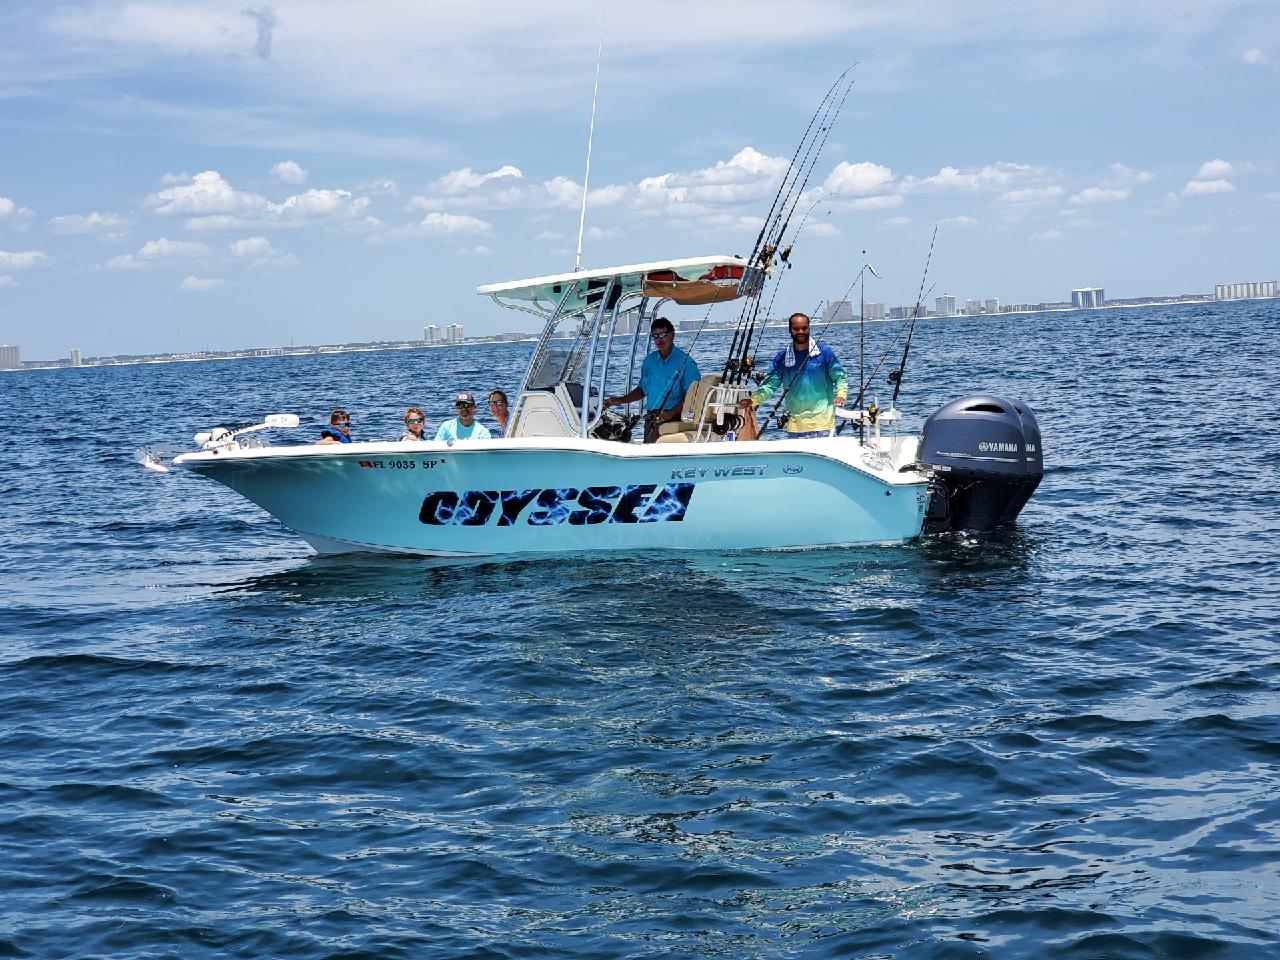
PCB Slammin Fun -24'

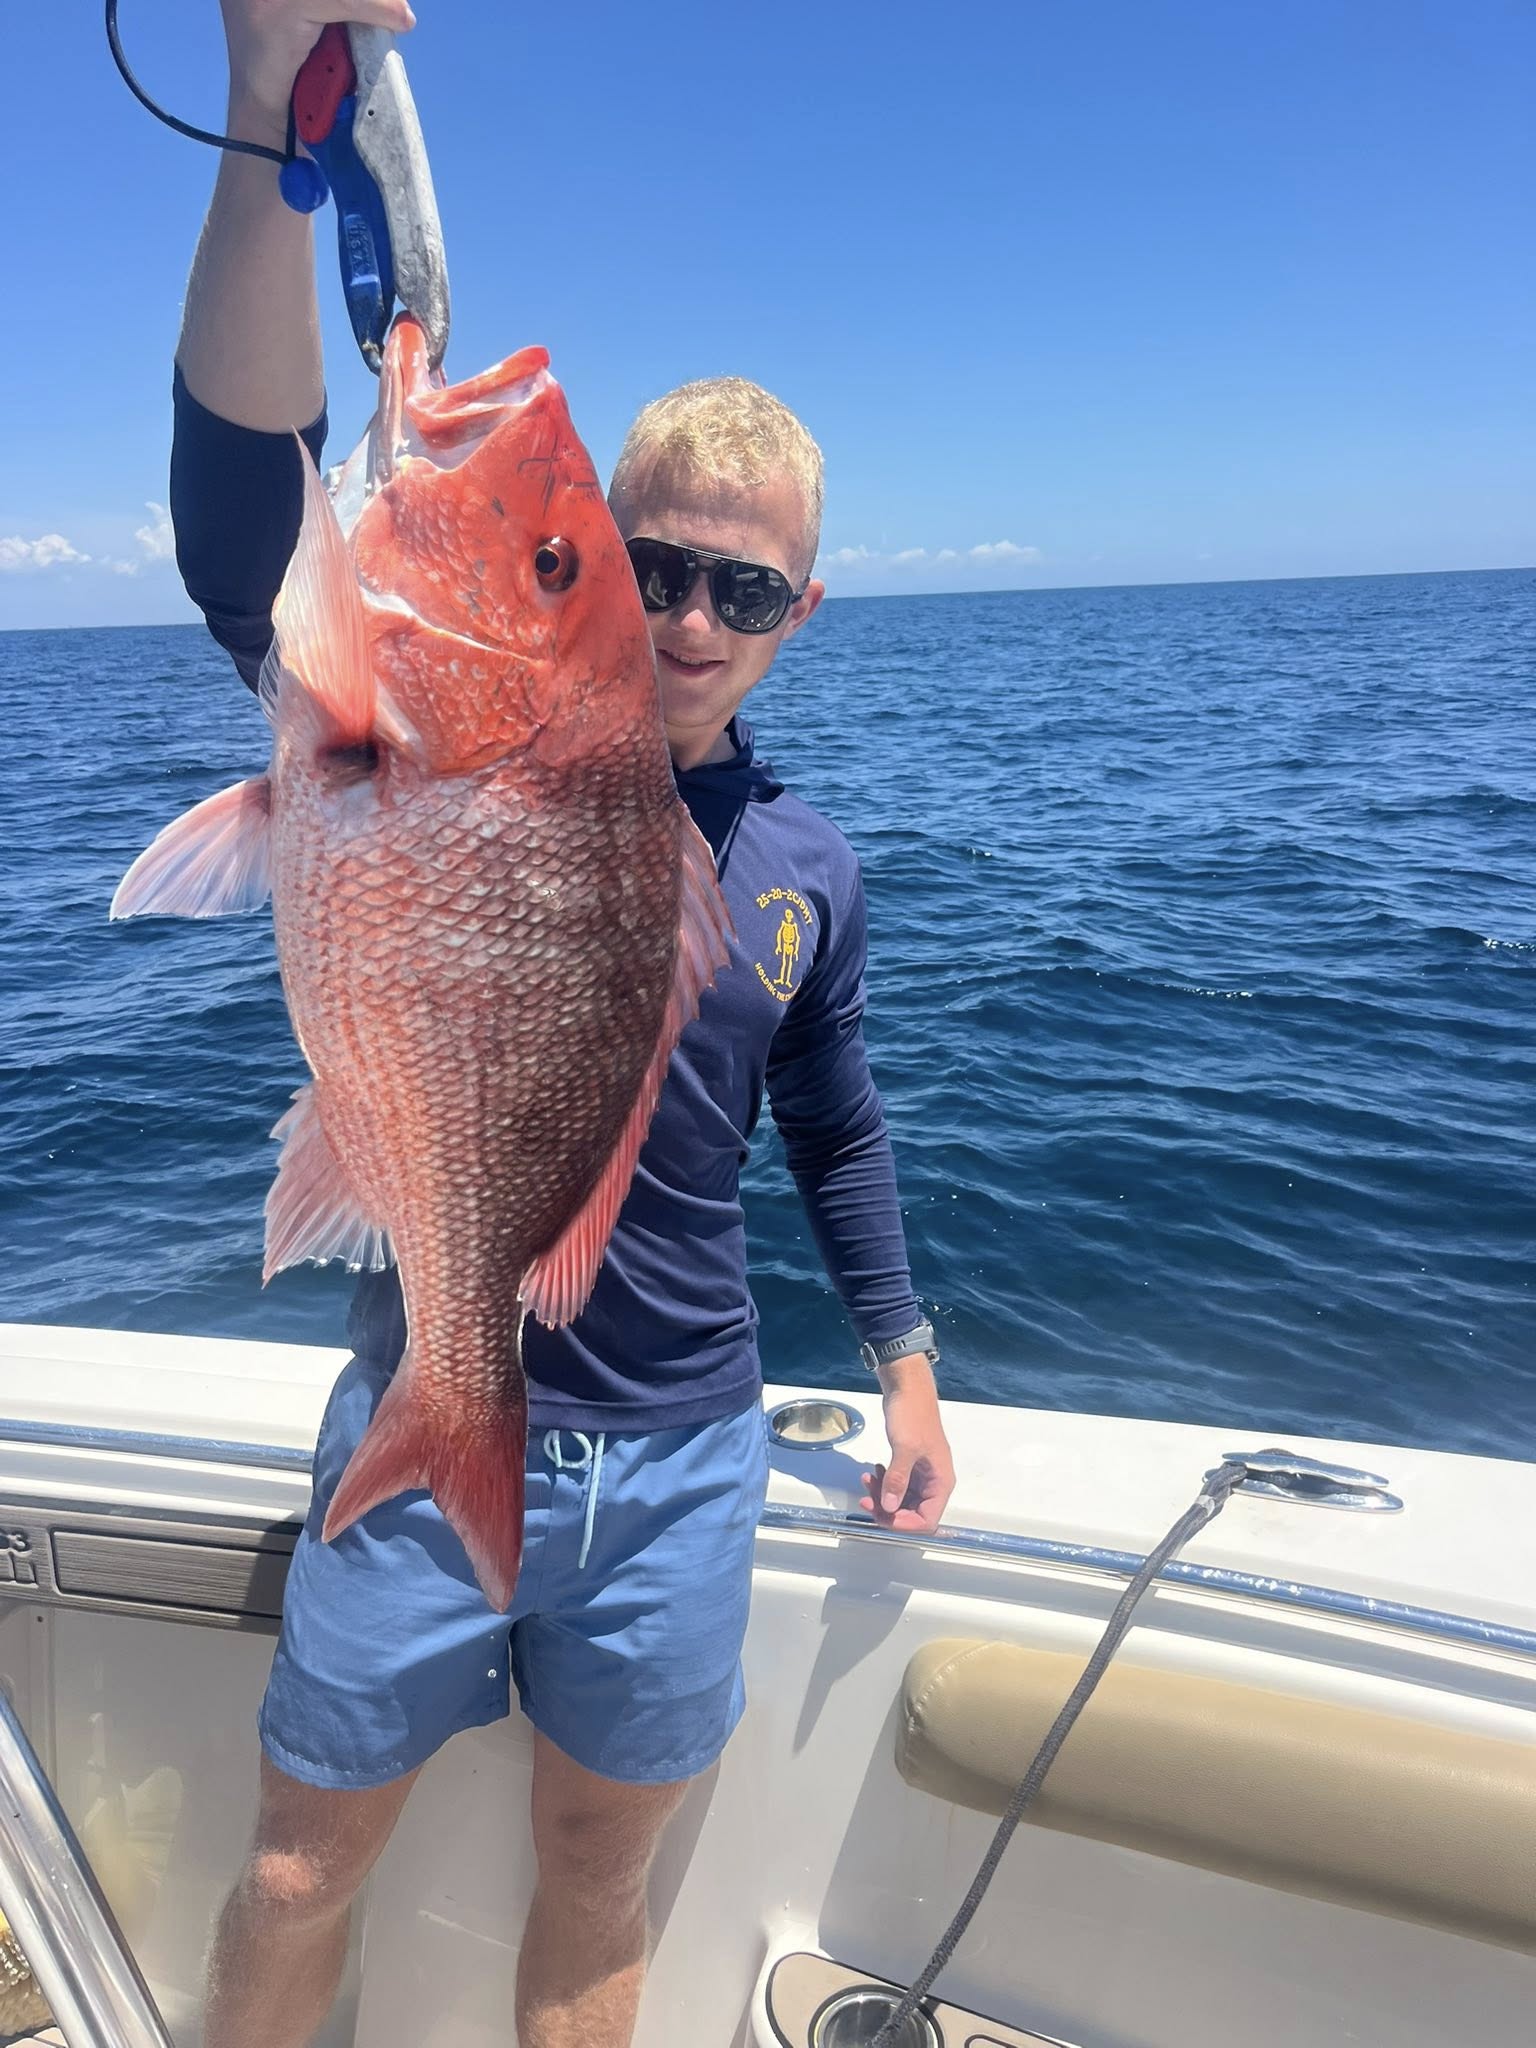
Deep Sea Fishing in Panama City Beach
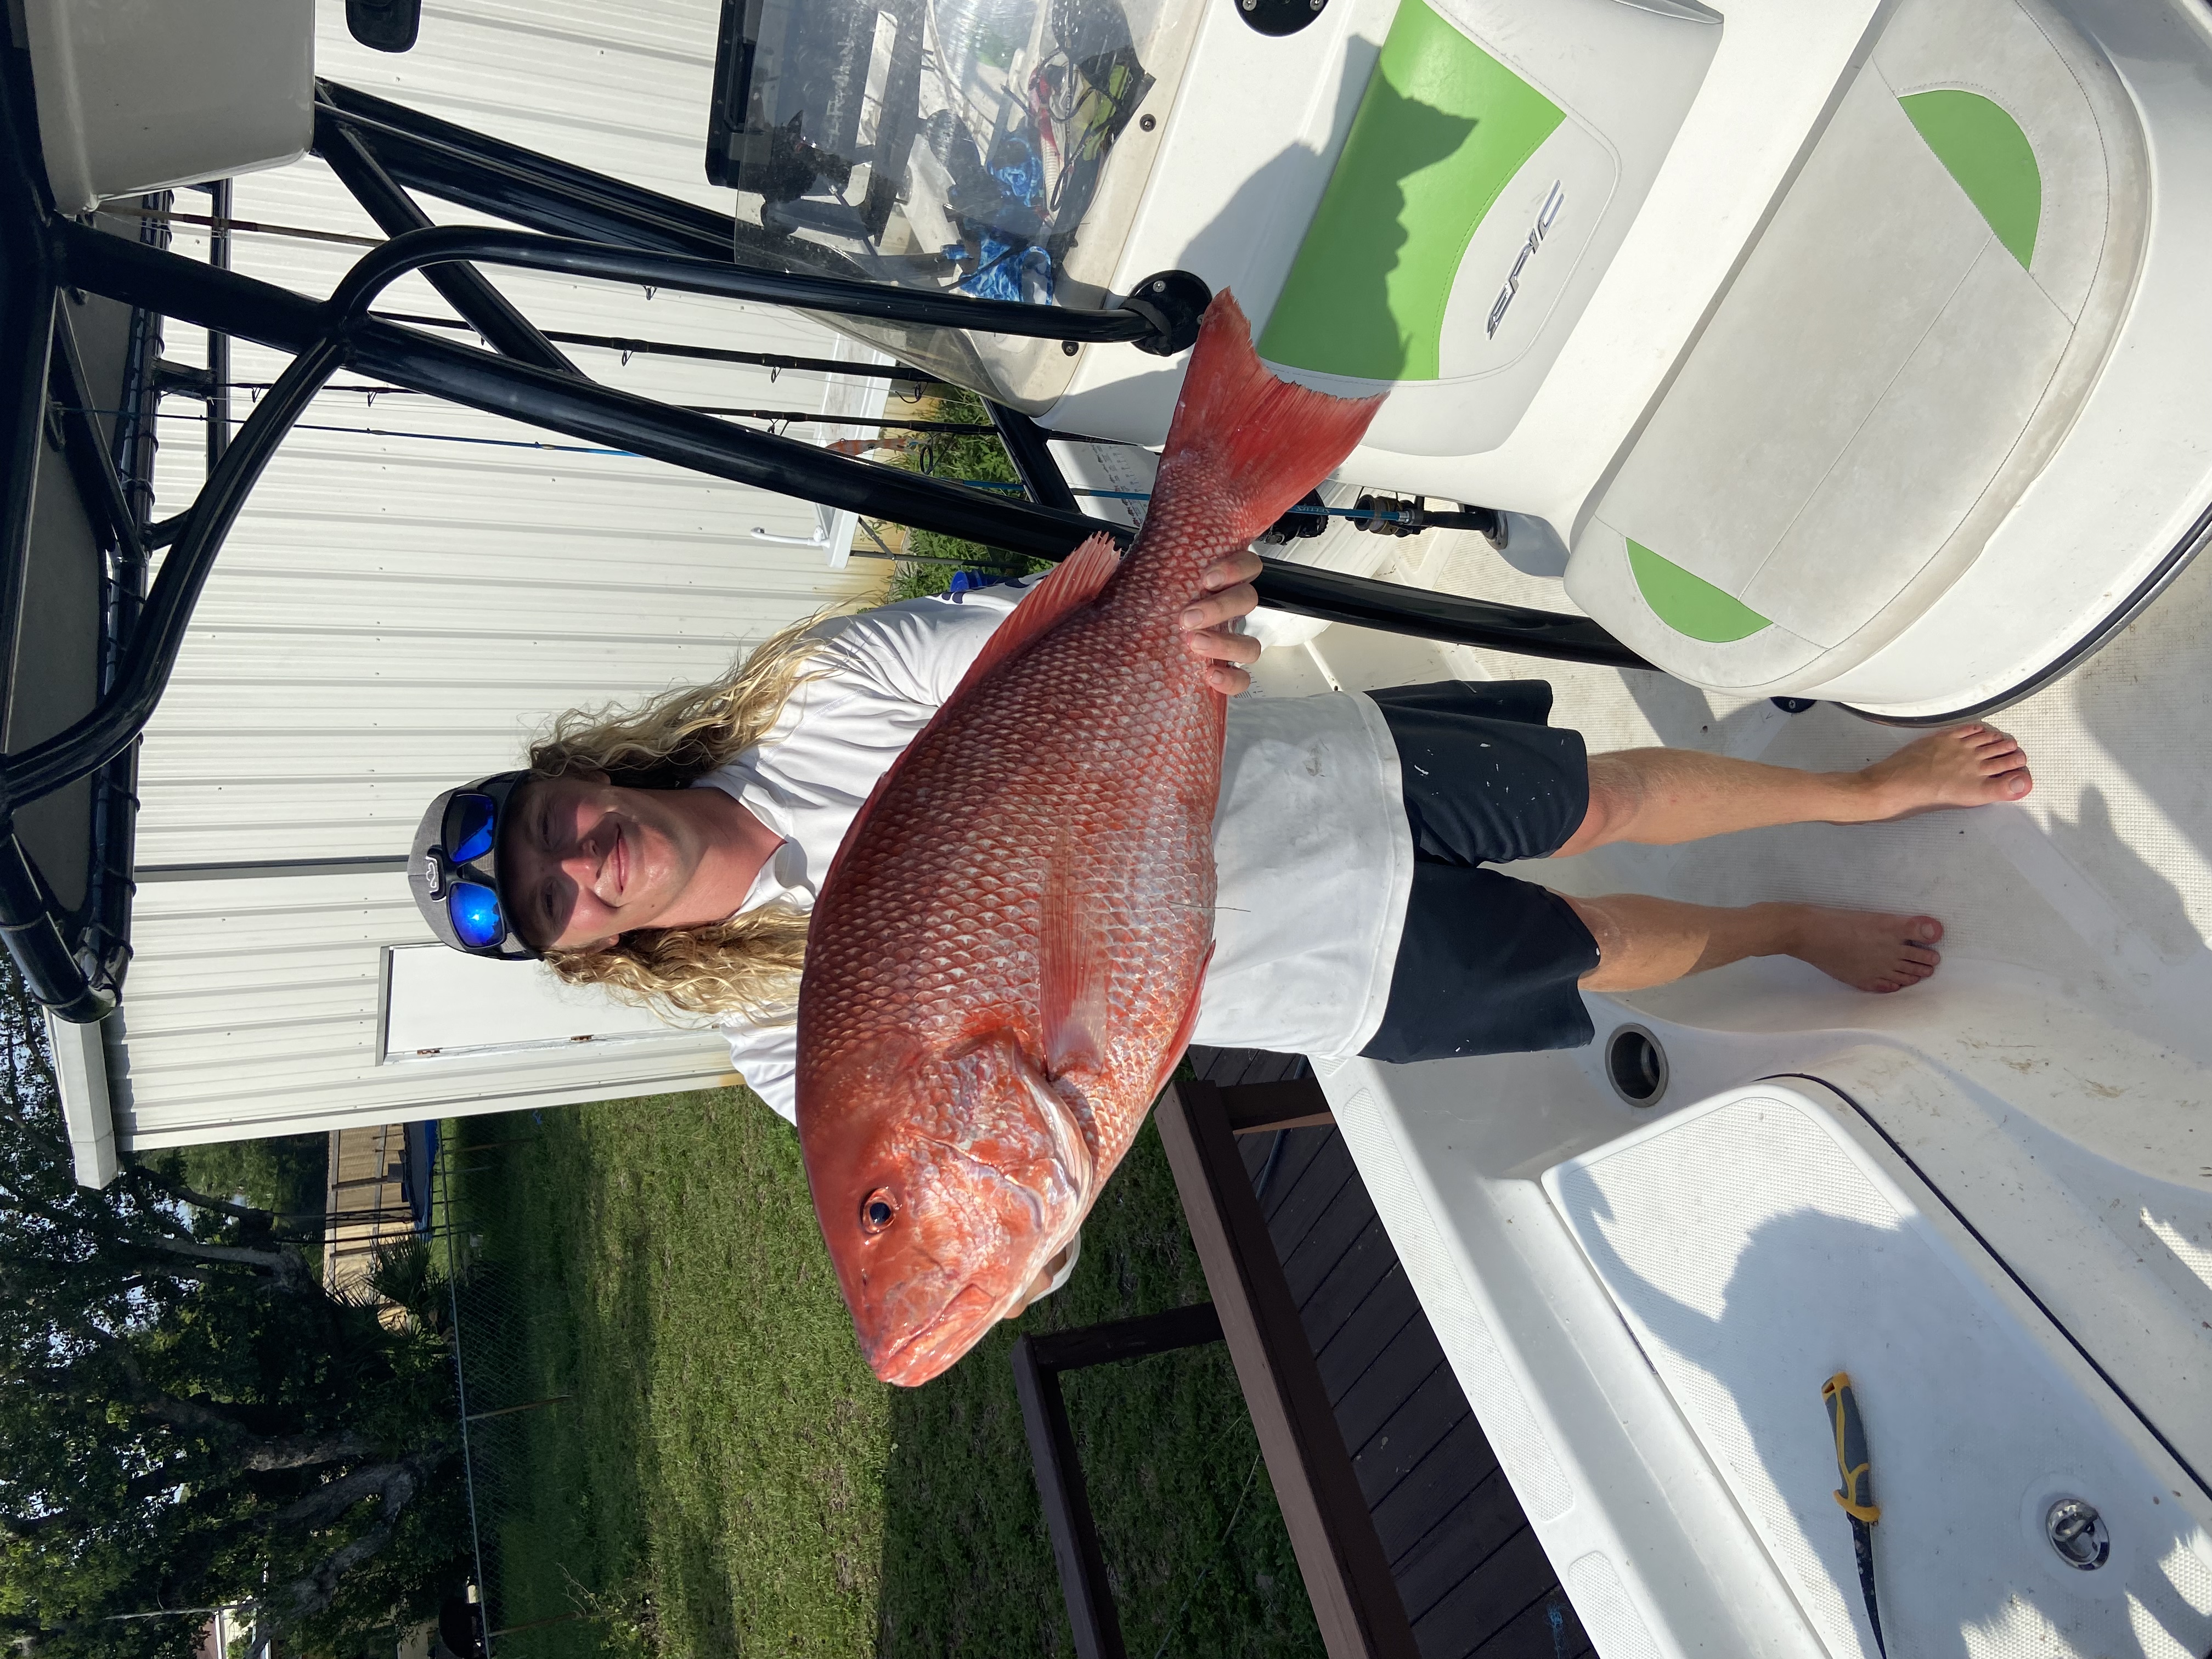
Grand PCB Red Snapper - 45'
Deep Sea Fishing in Panama City Beach
Red Snapper Bottom Fishing - 53'
Nearshore Fishing in Panama City Beach
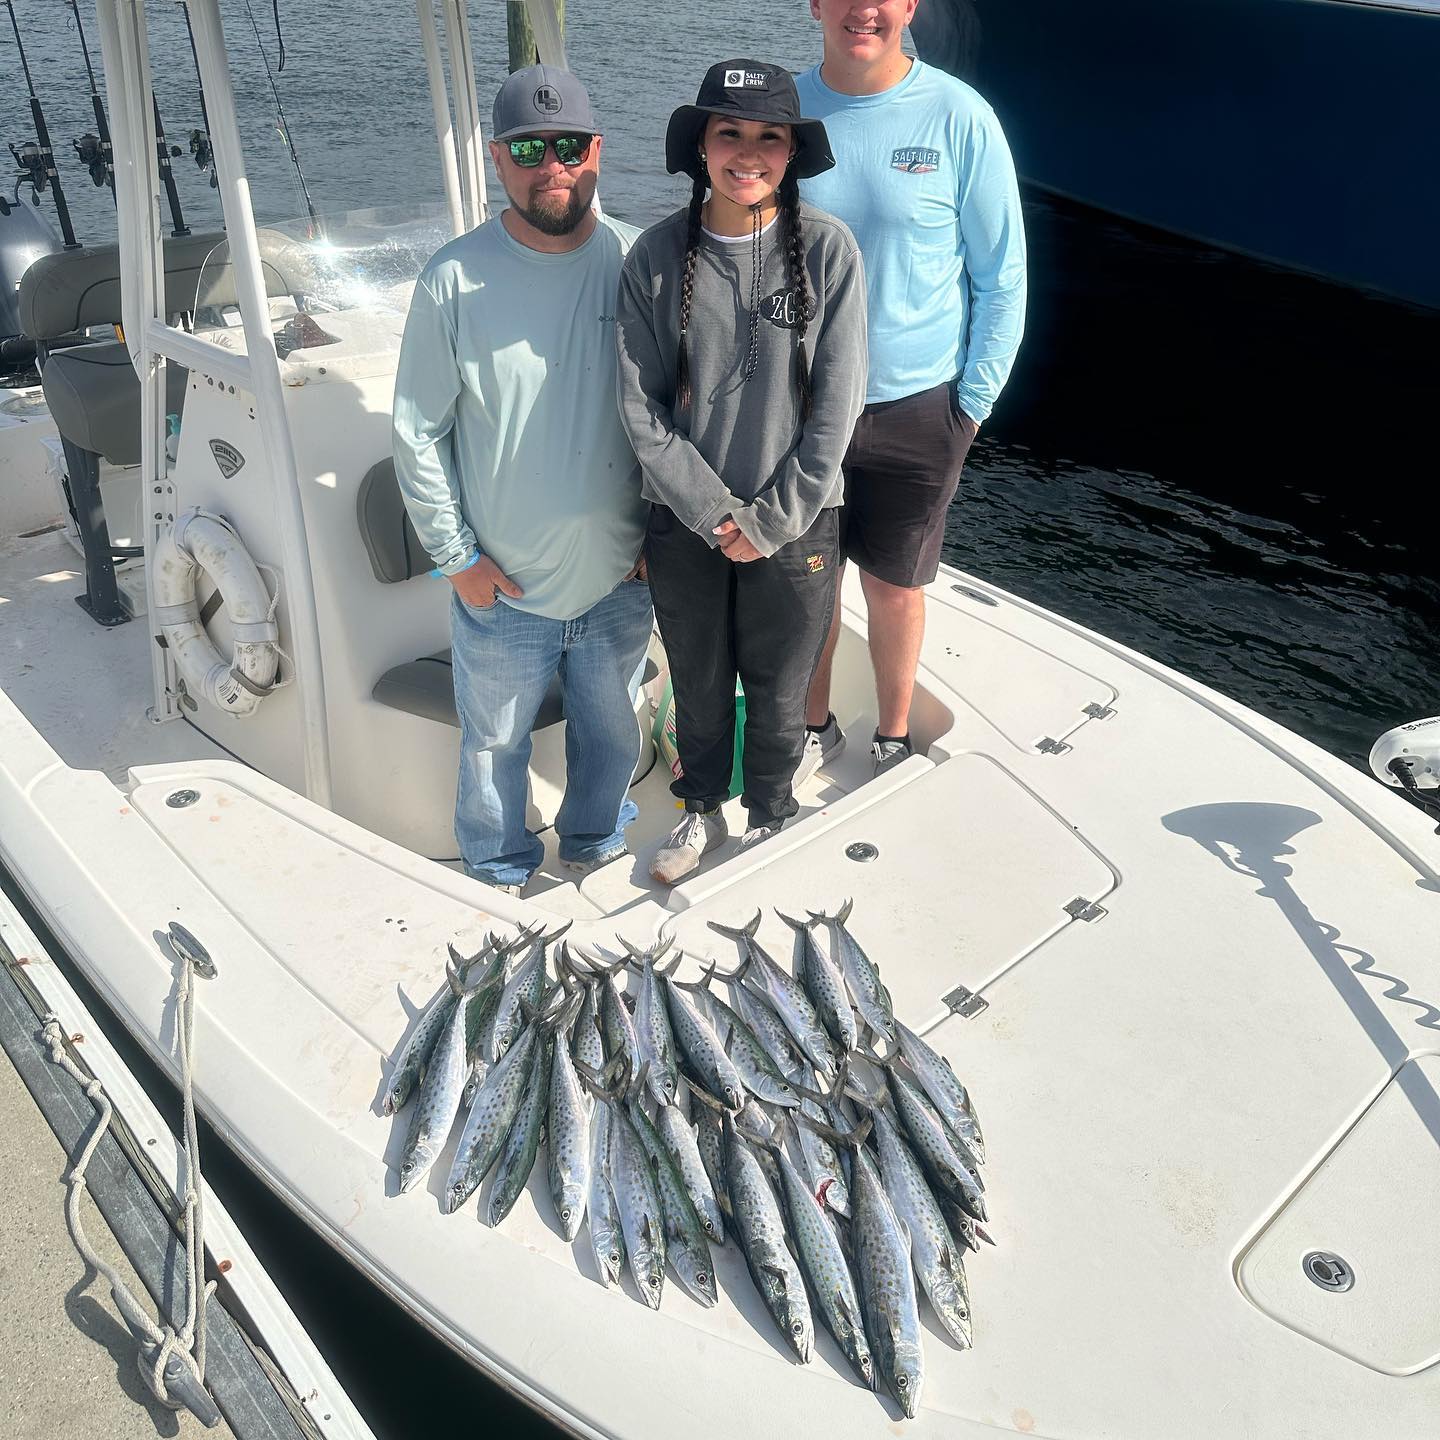
Spanish Mackerel Trolling
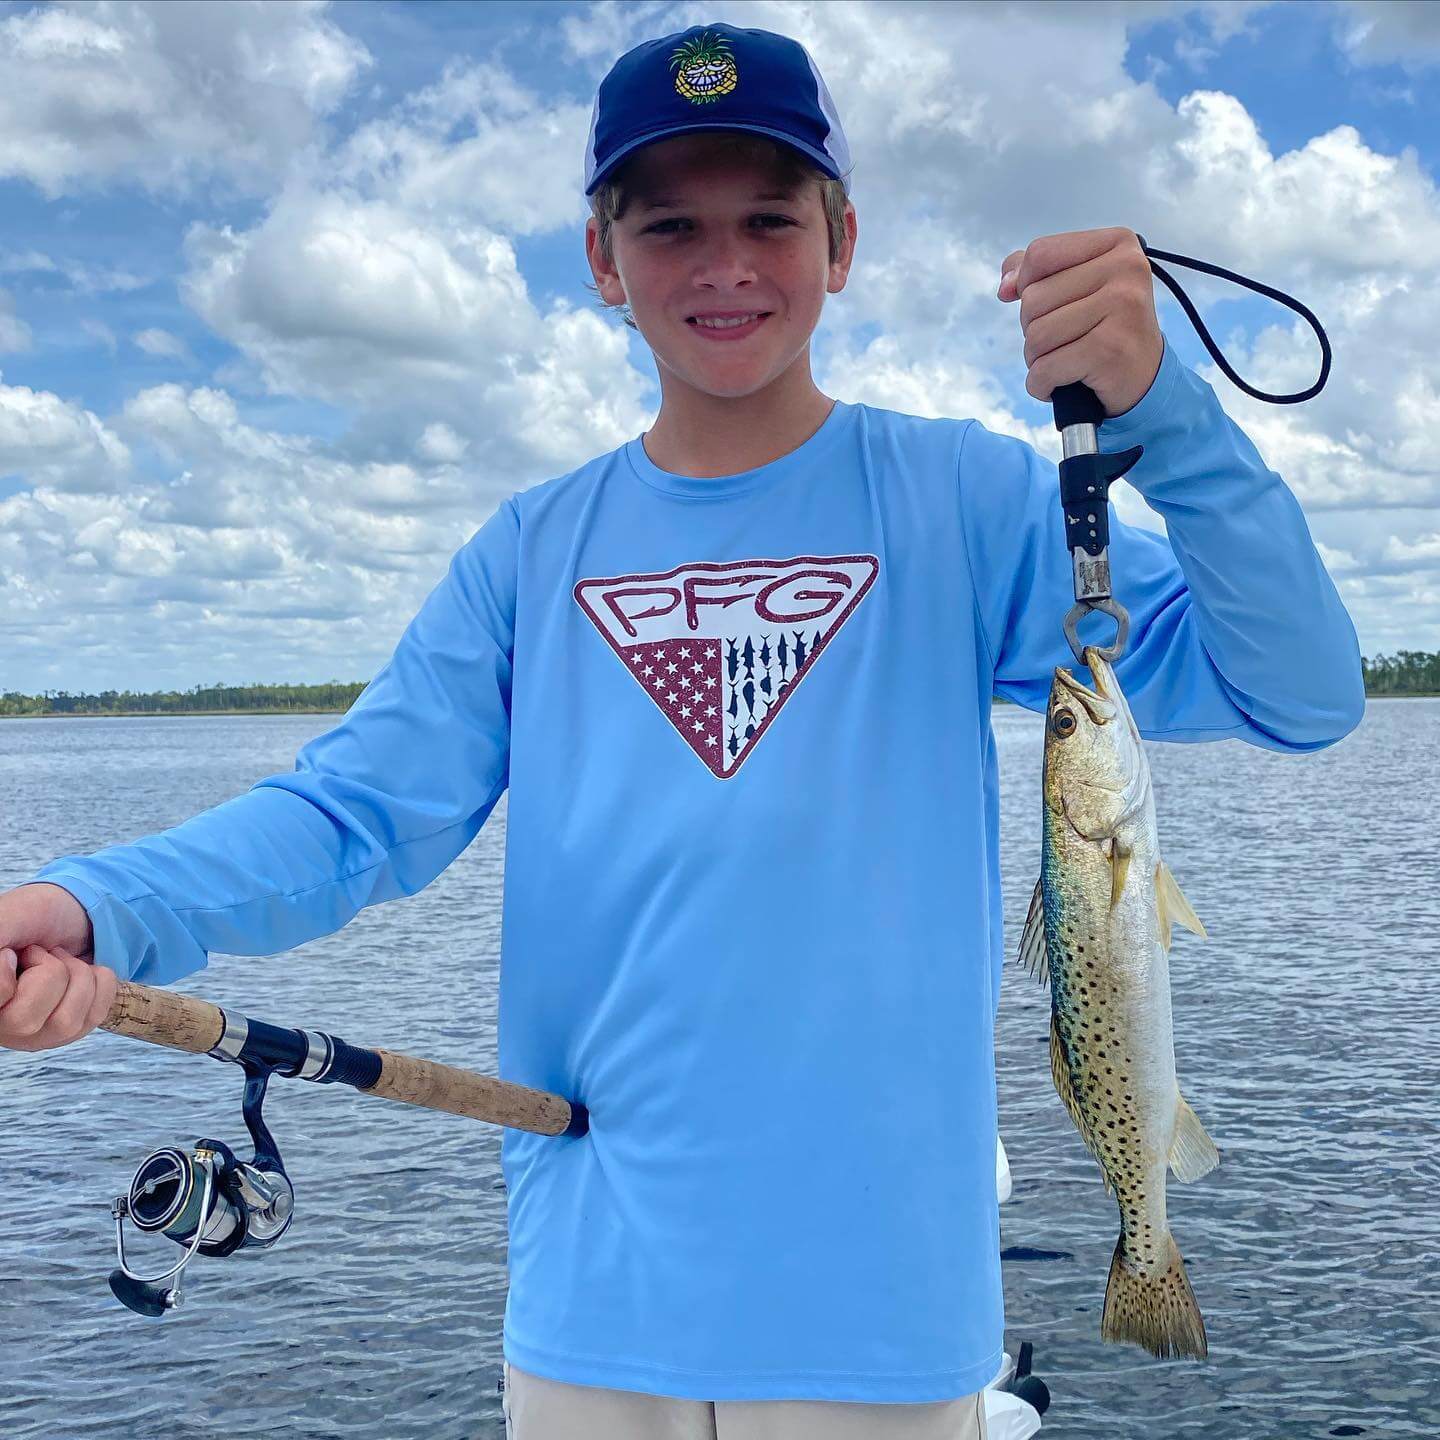
Inshore, Flats Fishing in Panama City Beach
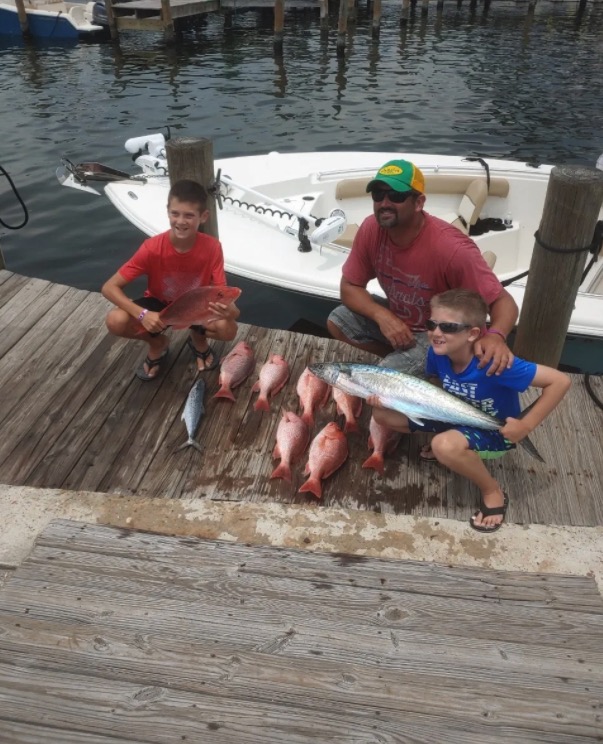
Kids Fishing Trips
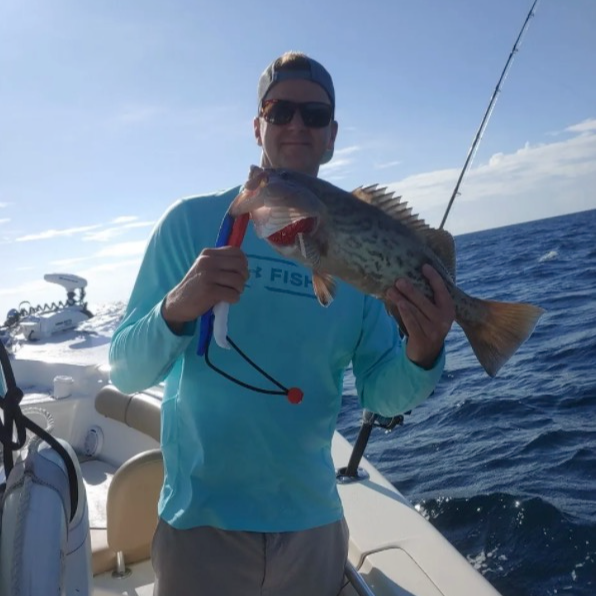
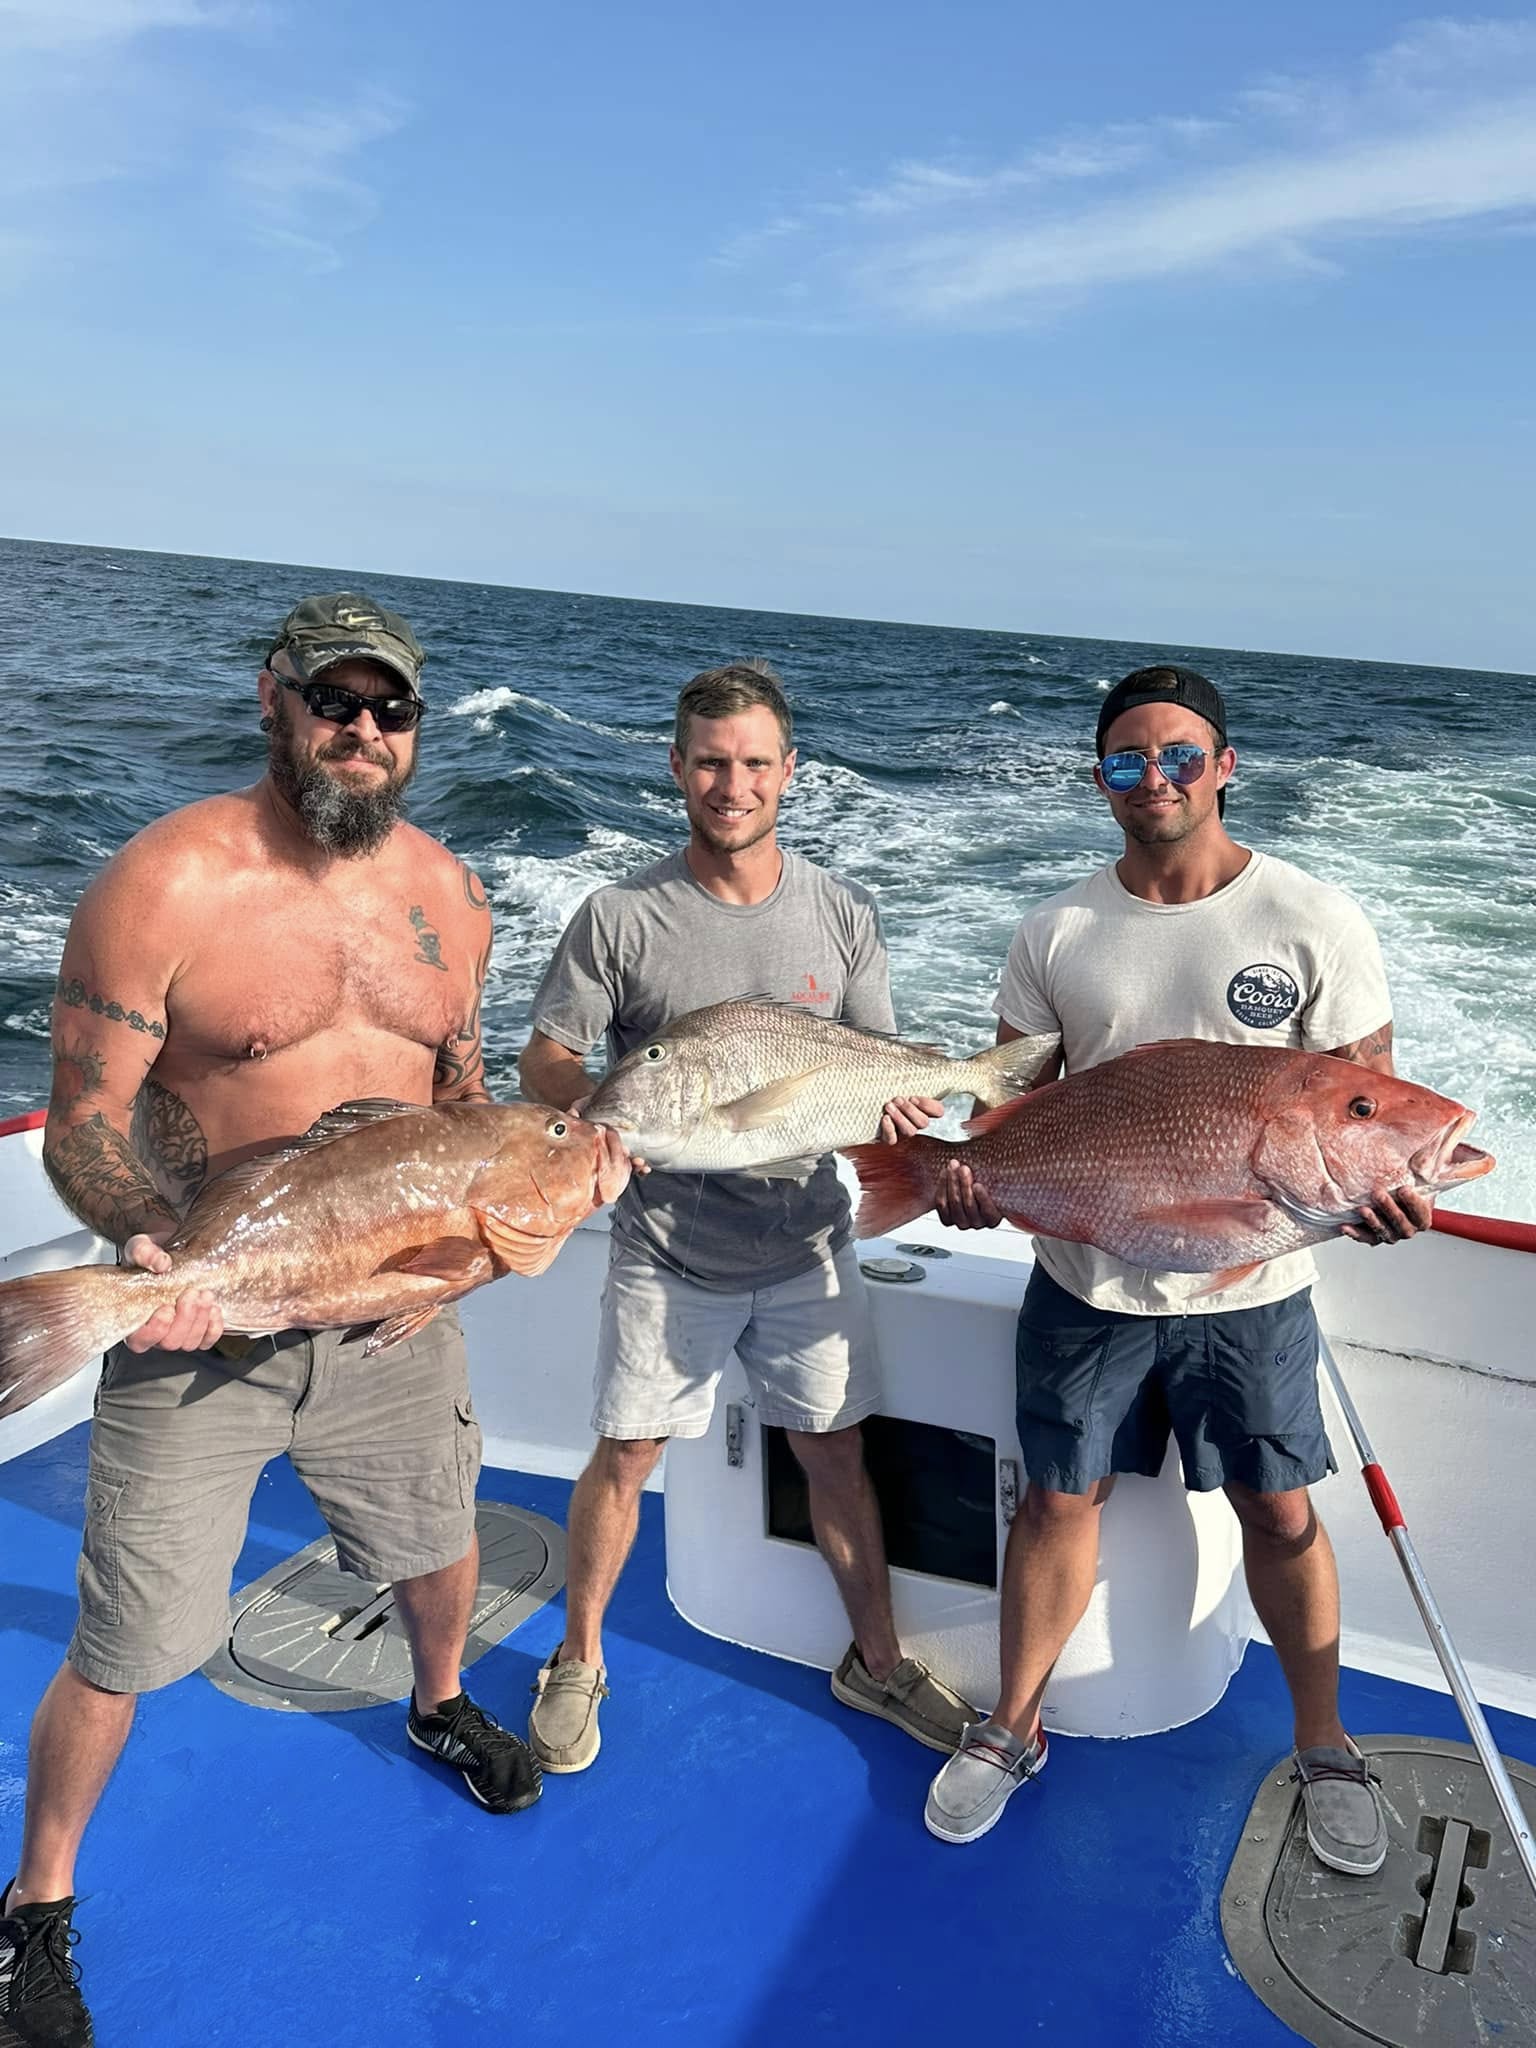
Nearshore Fishing in Panama City Beach
Summer Bottom Fishing
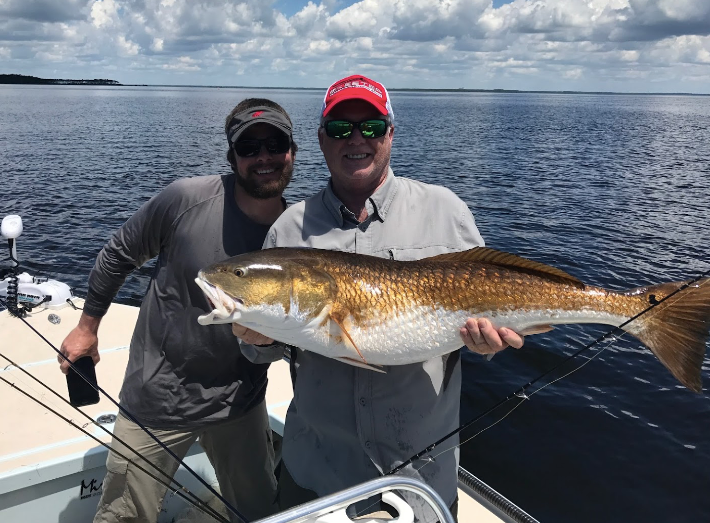
Inshore, Flats Fishing in Panama City Beach
Veteran Owned Offshore


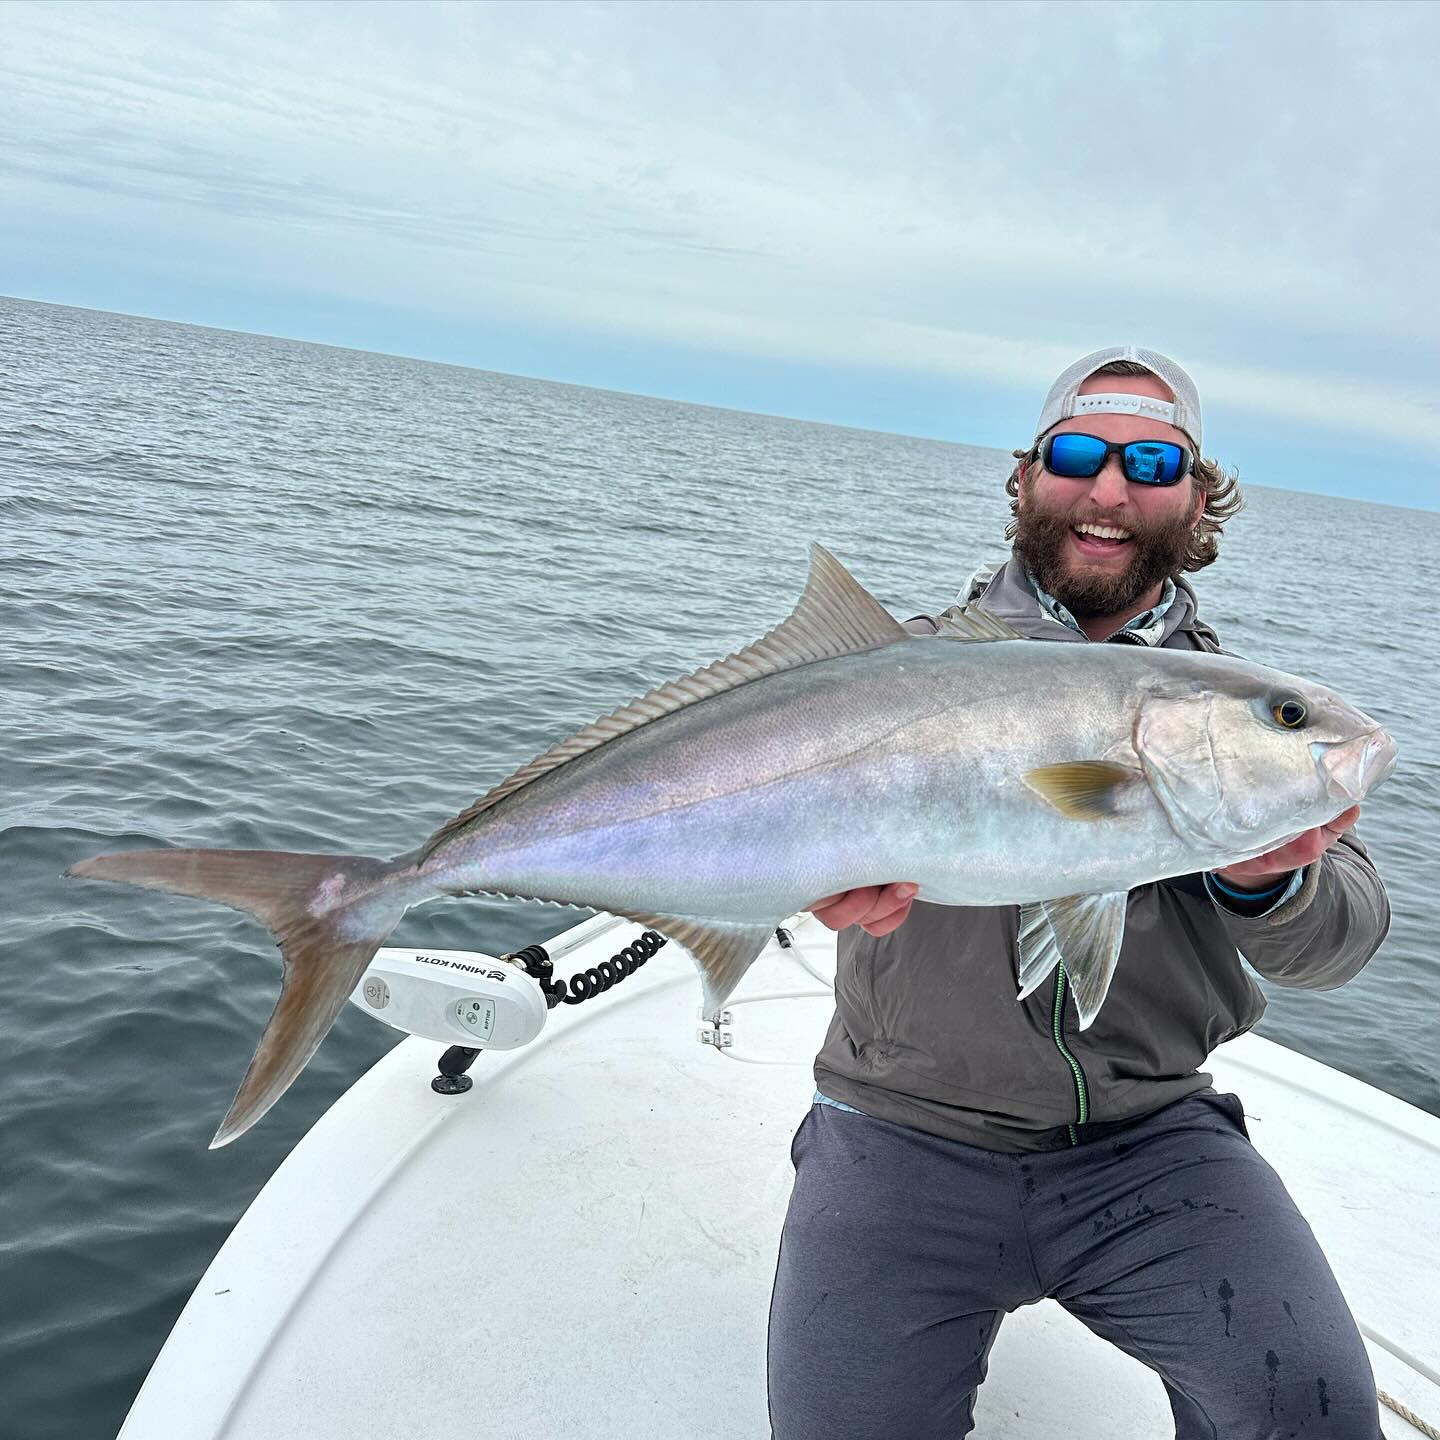
Deep Sea, Nearshore Fishing in Panama City Beach
Panama City Trolling Excitment

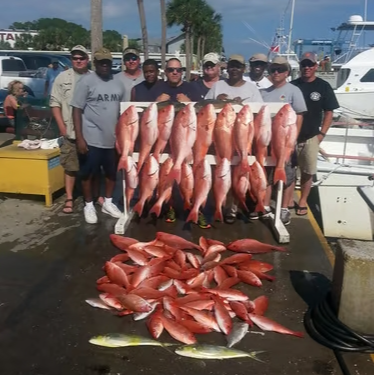
Nearshore Fishing in Panama City Beach
Gulf Fishing Experience
We started Captain Experiences to make it easy to book fishing and hunting guides around the world. With over 2,000 Damn Good Guides, our platform makes finding and booking a trip seamless. Head here to check out our trips.
Recent years have brought unusually high temperatures to the world’s waters—and with them, major impacts on marine life and coastal communities. However, since early 2023, this trend has significantly intensified, with each day for more than a year setting a new record high.
Several factors have likely contributed to these temperature increases—including rising greenhouse-gas levels creating excess atmospheric warming that absorbs into the world’s oceans—but climate scientists are having trouble completely explaining the anomalous warming. Some point to international fuel standards implemented in 2020 that reduced container ship aerosol pollution and the cooling effect that comes with it. Others attribute some of the rise to natural occurrences such as the underwater Hunga Tonga-Hunga Haʻapai volcano eruption in 2022 that sent up plumes of water vapor into the upper atmosphere that absorbs heat radiated from Earth and prevents it from escaping out to space.
The effects have created eye-popping weather and climate events in recent years. In early 2023, waters off the coast of South Florida reached more than 100 degrees—approximately the temperature of the water in a hot tub. Coral reefs have begun to experience bleaching at levels previously thought impossible, endangering one of the most important ecosystems for marine life. Hurricanes Lee and Otis last year became some of the fastest-intensifying storms in recorded history on their way to Category 5 strength, and the 2024 hurricane season is projected to be one of the most active on record.
Changes in Global Sea Water Temperature Over Time
In February 2024, ocean temperatures reached the highest level on record

Source: Captain Experiences analysis of the University of Maine's Climate Change Institute data
PLAN YOUR NEXT FISHING TRIP
Our Damn Good Guides go above and beyond to provide you an incredible trip, and we’ve handpicked every single experience to ensure they’re just right. In our Panama City Beach fishing charters guide, you can read about—and see pictures from—the 83 different trips we offer in Panama City alone. You can also book your trip from the guide in minutes, and our trips are backed by a 100% weather guarantee.
On February 29, 2024, the average global sea surface temperature reached a new daily high of 70.1 degrees Fahrenheit, highlighting the accelerating warming trend. Compared to previous decades, sea surface temperatures have been rising much faster each year. For example, the average ocean temperatures in 1990 and 2000 were extremely similar. However, by 2010, daily ocean temperatures exceeded those of 2000 by an average of 0.5 degrees Fahrenheit. In 2020, daily temperatures further surpassed those of 2010 by an average of 0.4 degrees Fahrenheit. And in just three years, average ocean temperatures in 2023 exceeded those of 2020 by another 0.4 degrees.
While the pace of change is alarming, the effects of these trends are not evenly distributed geographically. For coastal communities in the U.S., that means that some areas are more likely to be exposed to rising water temperatures than others. Communities that have experienced rapid increases in water temperatures may find themselves more vulnerable to extreme weather events—and with them, risks of extensive property damage, diminished economic activity, and the loss of human life.
Changes in Coastal Water Temperature by Location
The Gulf Coast saw the largest summer water temperature increases over the past decade

Source: Captain Experiences analysis of the National Oceanic and Atmospheric Administration’s Tides and Currents data
In the U.S., concerns are greatest for residents living near the Gulf of Mexico in states like Texas, Louisiana, and Florida. Over the last decade, the Gulf Coast has seen the greatest increase in water temperatures as measured in the summer, led by the Galveston Bay area in Texas with an 8.9 degree increase. In contrast, many locations in the Pacific Coast, northern Atlantic Coast, and Great Lakes regions saw minimal increases—or in some cases, declines—in summer surface water temperatures between 2013 and 2023.
Below is a list of the coastal areas that saw the biggest increase in water temperature over the last 10 years—from 2013 to 2023. The analysis was conducted by researchers at Captain Experiences, an online platform that helps people find and book fishing and hunting trips, using data from the National Oceanic and Atmospheric Administration. For more information on how each statistic was computed, refer to the methodology section below.
Coastal Areas That Saw the Biggest Increase in Water Temperature
In the U.S., concerns are greatest for residents living near the Gulf of Mexico in states like Texas, Louisiana, and Florida. Over the last decade, the Gulf Coast has seen the greatest increase in water temperatures as measured in the summer, led by the Raymondville area in Texas with a 6.5 degree increase. In contrast, many locations in the Pacific Coast, northern Atlantic Coast, and Great Lakes regions saw minimal increases—or in some cases, declines—in summer surface water temperatures between 2013 and 2023.
TRENDING ON CAPTAIN EXPERIENCES
Our Sarasota fishing charters guide has everything you need to book the perfect fishing trip in Florida. Find the best and worst months to catch all of the most popular fish species across the over 130 different trips offered in Sarasota—with photos and reviews for each and every experience.
Below is a breakdown of over 70 coastal areas that saw the biggest increase in water temperature over the last 10 years—from 2013 to 2023. The analysis was conducted by researchers at Captain Experiences, an online platform that helps people find and book fishing and hunting trips, using data from the National Oceanic and Atmospheric Administration. For more information on how each statistic was computed, refer to the methodology section below.
Atlantic Coast Metros That Saw the Biggest Increase in Water Temperature

Gulf Coast Metros That Saw the Biggest Increase in Water Temperature

LEARN MORE
With nearly 200 different trips offered—including both inshore and deep sea fishing excursions—our Port Aransas fishing charters are wildly popular and affordable.
Great Lakes Metros That Saw the Biggest Increase in Water Temperature

Pacific Coast Metros That Saw the Biggest Increase in Water Temperature

Methodology & Detailed Findings
The data used in this study is from the National Oceanic and Atmospheric Administration’s Tides and Currents series. To determine the coastal areas that saw the biggest increase in water temperature, researchers at Captain Experiences calculated the average summer water temperature change from 2013 to 2023 across each coastal metropolitan and micropolitan area. Average summer water temperatures were calculated by averaging hourly surface water temperatures for July, August, and September, and peak summer water temperatures were calculated using the largest average monthly water temperature for any given meteorological or physical oceanographical station located within each coastal area. Additionally, only metropolitan and micropolitan areas with sufficient coastal sea water temperature data were included.
References
- Schmidt, G. (2024, March 19). Climate models can’t explain 2023’s huge heat anomaly — we could be in uncharted territory. Nature. Retrieved on May 21, 2024 from Nature.
- Hausfather, Z., et al. (2023, July 3). Analysis: How low-sulphur shipping rules are affecting global warming. Carbon Brief. Retrieved on May 21, 2024 from Carbon Brief.
- Besl, J. (2023, March 16). Tonga eruption may temporarily push Earth closer to 1.5°C of warming. Eos. Retrieved on May 21, 2024 from EOS.
- Livingston, I., et al. (2023, July 26). In hot water: South Florida ocean tops 100 degrees. Washington Post. Retrieved on May 21, 2024 from Washington Post.
- Diaz, et al. (2023, October 30). As Oceans Warm, Coral Bleaching Seen at Greater Depths. Yale Environment 360. Retrieved on May 21, 2024 from E360.
- Masters, J., et al. (2023, September 7). Hurricane Lee rapidly intensifying, expected to hit Cat 5. Yale Climate Connections. Retrieved on May 21, 2024 from Yale Climate Connections.
- National Environmental Satellite, Data, and Information Service. (2023, November 2). Hurricane Otis Causes Catastrophic Damage in Acapulco, Mexico. Retrieved on May 21, 2024 from Nesdis.
- Belles, J. (2024, May 15). New Outlook: Atlantic Hurricane Season To Be Busier Than Previously Expected. The Weather Channel. Retrieved on May 21, 2024 from Weather.
- National Oceanic and Atmospheric Administration. (2023). Tides and Currents [Dataset]. Retrieved on May 21, 2024 from Tides & Currents.
Jake Lane
Updated on February 19, 2025

January 7, 2022

November 7, 2023

July 1, 2024

July 31, 2024

April 26, 2022
Related Articles

August 17, 2023

September 26, 2022

September 29, 2022
Featured Locations
- Fishing Charters Near Me
- Austin Fishing Guides
- Biloxi Fishing Charters
- Bradenton Fishing Charters
- Cabo San Lucas Fishing Charters
- Cancun Fishing Charters
- Cape Coral Fishing Charters
- Charleston Fishing Charters
- Clearwater Fishing Charters
- Corpus Christi Fishing Charters
- Crystal River Fishing Charters
- Dauphin Island Fishing Charters
- Daytona Beach Fishing Charters
- Destin Fishing Charters
- Fort Lauderdale Fishing Charters
- Fort Myers Fishing Charters
- Fort Walton Beach Fishing Charters
- Galveston Fishing Charters
- Gulf Shores Fishing Charters
- Hatteras Fishing Charters
- Hilton Head Fishing Charters
- Islamorada Fishing Charters
- Jacksonville Fishing Charters
- Jupiter Fishing Charters
- Key Largo Fishing Charters
- Key West Fishing Charters
- Kona Fishing Charters
- Lakeside Marblehead Fishing Charters
- Marathon Fishing Charters
- Marco Island Fishing Charters
- Miami Fishing Charters
- Montauk Fishing Charters
- Morehead City Fishing Charters
- Naples Fishing Charters
- New Orleans Fishing Charters
- New Smyrna Beach Fishing Charters
- Ocean City Fishing Charters
- Orange Beach Fishing Charters
- Panama City Beach Fishing Charters
- Pensacola Fishing Charters
- Pompano Beach Fishing Charters
- Port Aransas Fishing Charters
- Port Orange Fishing Charters
- Rockport Fishing Charters
- San Diego Fishing Charters
- San Juan Fishing Charters
- Sarasota Fishing Charters
- South Padre Island Fishing Charters
- St. Augustine Fishing Charters
- St. Petersburg Fishing Charters
- Tampa Fishing Charters
- Tarpon Springs Fishing Charters
- Venice Fishing Charters
- Virginia Beach Fishing Charters
- West Palm Beach Fishing Charters
- Wilmington Fishing Charters
- Wrightsville Beach Fishing Charters

