River, Lake Fishing in Knights Landing
Fishing Trip

River, Lake Fishing in Stockton
California Delta Freshwater Trip

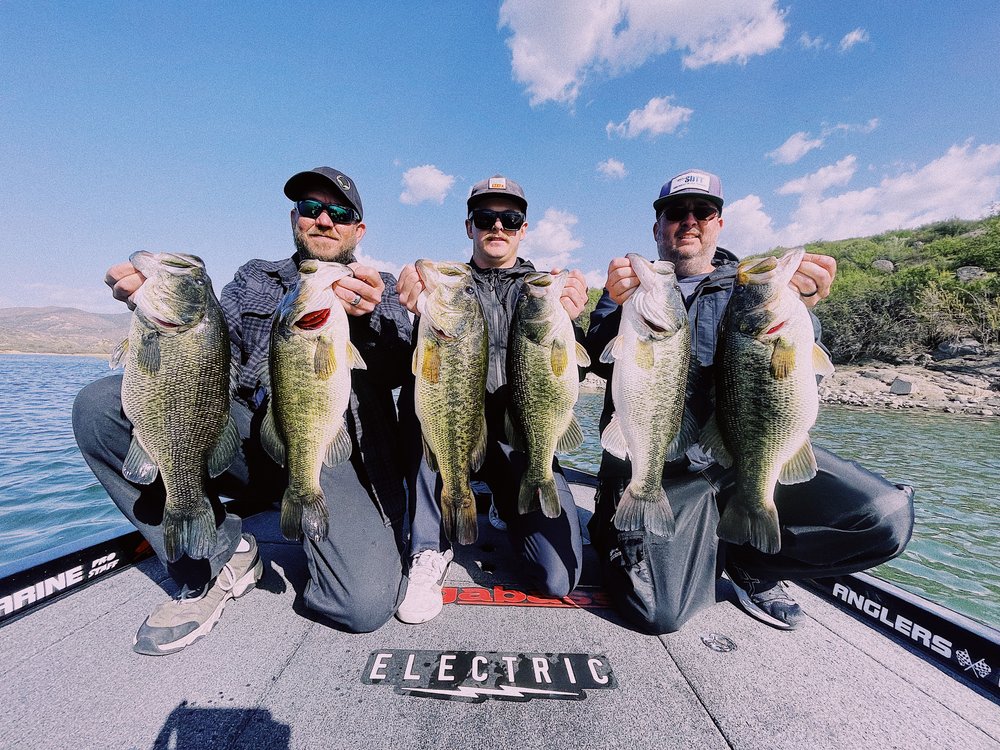
Lake Powell Fishing Trips


Sequoia National Forest Fly Fishing
Clear Lake Ultimate Bass Fishing

Pyramid Lake Trophy Cutthroats

Lake Casitas Bass Fishing Trip

Nearshore, River, Flats in Bethel Island
Dirty Delta 2 Person Trip
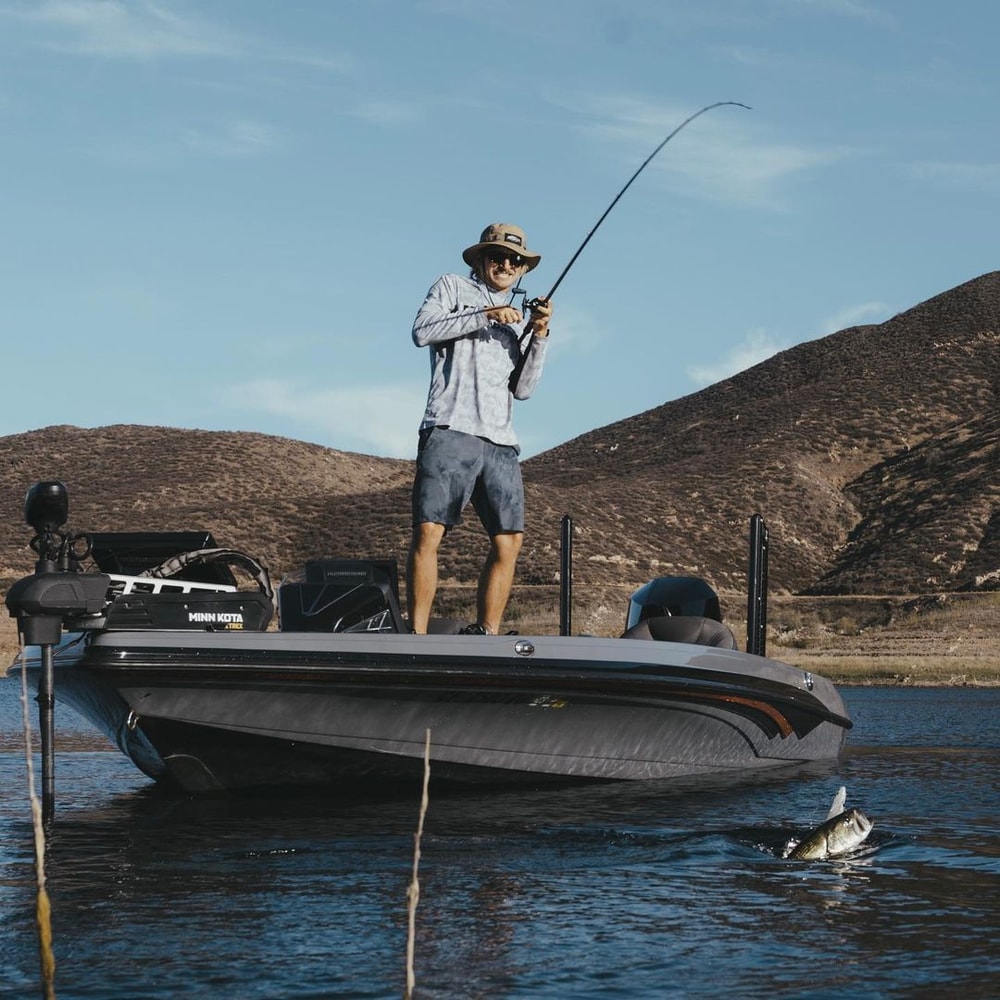
Socal Bass Fishing Trip
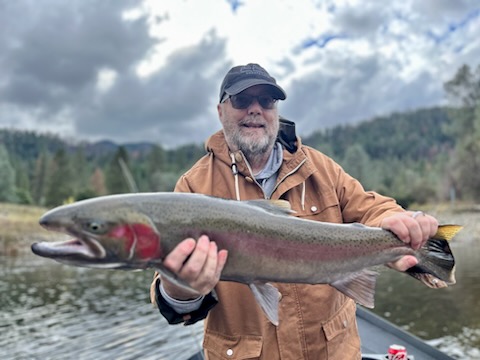
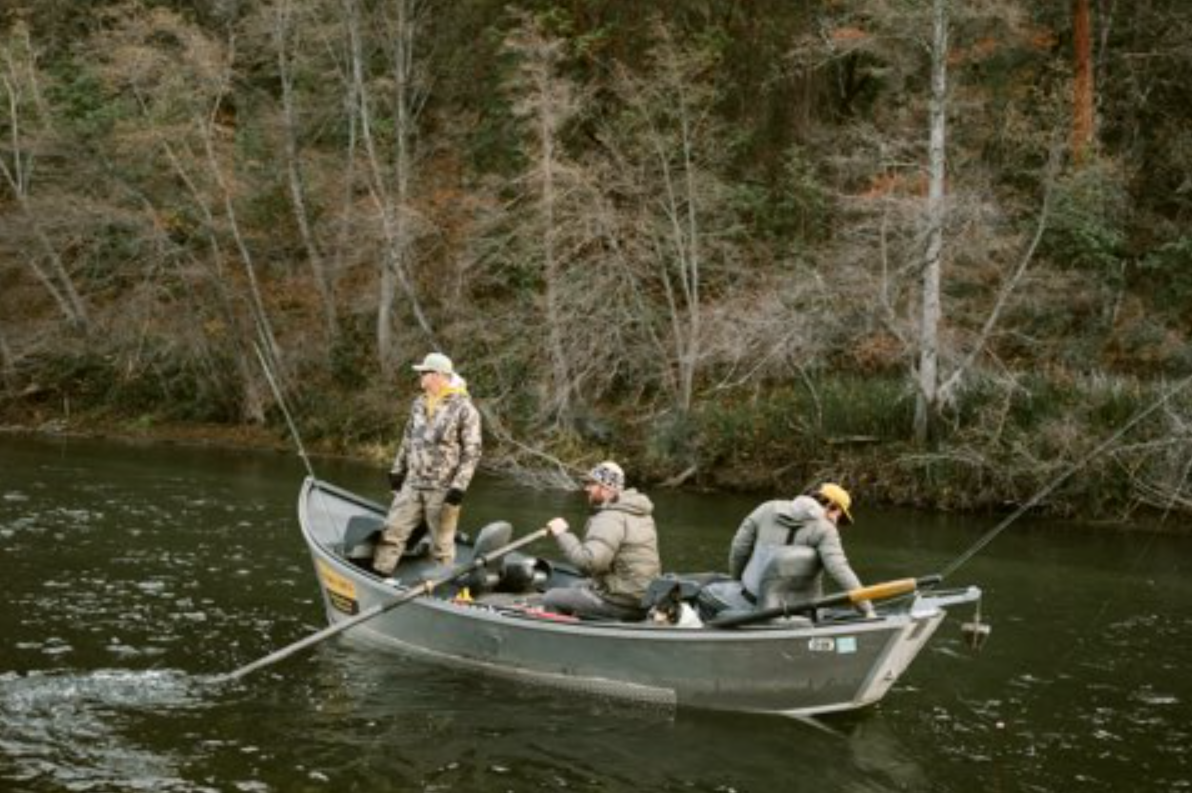
Steelhead In The Trinity River
We started Captain Experiences to make it easy to book fishing and hunting guides around the world. With over 2,000 Damn Good Guides, our platform makes finding and booking a trip seamless. Head here to check out our trips.
As 2024 unfolds, it is rapidly becoming the hottest year on record, with unprecedented temperatures being recorded around the world. The sweltering heat is not just uncomfortable but has far-reaching implications for the environment, agriculture, and water resources, exacerbating already existing drought conditions in many regions.
The correlation between rising temperatures and the frequency and severity of severe weather events, including droughts, is well-documented. As temperatures go up, evaporation increases, leading to reduced soil moisture and lower water levels in rivers, lakes, and reservoirs. This amplifies periods of low precipitation and not only impacts agriculture but also stresses the water supply for industrial and residential use. Moreover, the combination of high temperatures and dry conditions creates a perfect storm for wildfires, which have increasingly been impacting large areas in the western U.S.
Taken together, these changing climate patterns are creating a vicious cycle where hotter temperatures lead to more severe droughts, which in turn contribute to even higher temperatures.
How Many Americans Are Experiencing Drought Conditions Currently?

Source: Captain Experiences analysis of U.S. Drought Monitor data
In the first half of 2024, an average of 25.5% of the U.S. population, equating to over 85 million Americans, experienced abnormally dry conditions or worse in any given week. Of these, around 36.4 million people (10.9%) dealt with moderate drought or worse, while about 11.4 million (3.4%) faced severe drought or worse.
The economic and social impacts of droughts are multifaceted. Economically, droughts affect several industries reliant on a steady water supply, but the impacts are perhaps most pronounced in the agricultural sector, with crops failing and livestock suffering due to lack of water and food to graze on. This not only affects farmers' livelihoods but also leads to higher food prices for consumers.
Socially, droughts can lead to water rationing and restrictions, affecting daily life and increasing tensions among local communities. Droughts negatively impact recreational activities like fishing, boating, and hiking when lake levels recede, rivers run dry, or public land closes. In extreme cases, prolonged droughts can result in population displacement as people are forced to move to areas with more reliable water sources.
How Have Drought Conditions Changed Over Time?

Graph showing drought levels over time
Despite a quarter of the U.S. population living in abnormally dry conditions or worse, current drought conditions nationally are relatively mild compared to recent years. Since 2000, the United States has experienced several significant droughts, notably the 2000–2004 Western United States drought, the 2010–2015 Southern Plains drought, and the 2012–2016 California drought.
The 2000–2004 drought severely impacted the Western U.S., including Arizona, Nevada, Utah, and California, leading to major reservoirs like Lake Powell and Lake Mead receding. As a result of water shortages, the agricultural sector suffered immensely, with reduced crop yields and livestock production. Competition and tensions over water allocation strained communities across several states.
The 2010–2015 drought hit Texas and the Southern Plains hard, resulting in the driest year in Texas history. Agricultural losses exceeded $7.62 billion in 2011 alone, affecting crops like cotton, corn, and wheat, and causing severe livestock losses. This drought also contributed to widespread wildfires and critical water supply issues.
The 2012–2016 California drought was one of the state's most severe, resulting in a significant decline in Sierra Nevada snowpack. This led to substantial agricultural challenges, economic losses, mandatory water restrictions, and widespread environmental consequences, including fires, tree mortality, and loss of wildlife habitat.
U.S. Drought Conditions by Location

Today, even amidst relatively mild drought conditions nationally, certain areas are grappling with extremely dry conditions. The Drought Severity and Coverage Index (DSCI) provides a measure of these conditions by converting a location’s drought severity levels into a single statistic ranging from 0 to 500, where zero indicates no abnormal dryness and 500 means the entire area is in exceptional drought.
During the first half of 2024, nearly all of New Mexico’s population experienced abnormally dry conditions, with approximately half facing severe drought conditions or worse each week. Similar or worse conditions exist in neighboring areas of Texas and Arizona. For example, El Paso County, TX, has experienced the most severe drought conditions of any county in the United States this year, with nearly all residents facing severe drought or worse. Nearby Cochise County, AZ, faced similar conditions, albeit slightly less severe.
In the Mountain region, parts of Montana and Idaho have also experienced extremely dry conditions. In Missoula and Flathead Counties in Montana, and Kootenai County, ID, all residents faced an abnormally dry year, with over 90% experiencing at least moderate drought.
In the Midwest, Iowa and Kansas have had a particularly dry year. Iowa ranks as the second driest state, with roughly a third of its residents facing severe droughts or worse. Kansas ranks fifth driest, with nearly 9% of its residents experiencing severe drought conditions or worse.
Below is a breakdown of the U.S. counties and states that have faced the worst drought conditions so far this year. The analysis was conducted by Captain Experiences, a fishing and hunting guide reservation platform, using data from the U.S. Drought Monitor. For more information, see the methodology section below.
Driest Counties & States in the U.S.

Methodology
The data used in this study is from the U.S. Drought Monitor, which is a collaboration between the University of Nebraska-Lincoln, the United States Department of Agriculture, and the National Oceanic and Atmospheric Administration. To determine the locations that have experienced the worst drought conditions so far in 2024, researchers at Captain Experiences calculated the average Drought Severity and Coverage Index (DSCI) between January 1, 2024 and July 25, 2024. The DSCI ranges from 0-500, where zero indicates that none of the area is abnormally dry or in drought and 500 means that all of the area is in exceptional drought. Researchers also calculated the percentage of the population and total population in each drought severity category, averaged over the same time period. To improve relevance, only counties with at least 100,000 residents were included in the final county lists. Counties were also categorized in the following size cohorts based on population: small (100,000–249,999), midsize (250,000–499,999), and large (500,000 or more).
Jake Lane
Updated on November 6, 2024

June 22, 2022

January 7, 2022

March 8, 2022

August 21, 2023

November 15, 2023
Related Articles

August 17, 2023

May 13, 2024

February 28, 2020
Featured Locations
- Fishing Charters Near Me
- Austin Fishing Guides
- Biloxi Fishing Charters
- Bradenton Fishing Charters
- Cabo San Lucas Fishing Charters
- Cancun Fishing Charters
- Cape Coral Fishing Charters
- Charleston Fishing Charters
- Clearwater Fishing Charters
- Corpus Christi Fishing Charters
- Crystal River Fishing Charters
- Dauphin Island Fishing Charters
- Daytona Beach Fishing Charters
- Destin Fishing Charters
- Fort Lauderdale Fishing Charters
- Fort Myers Fishing Charters
- Fort Walton Beach Fishing Charters
- Galveston Fishing Charters
- Gulf Shores Fishing Charters
- Hatteras Fishing Charters
- Hilton Head Fishing Charters
- Islamorada Fishing Charters
- Jacksonville Fishing Charters
- Jupiter Fishing Charters
- Key Largo Fishing Charters
- Key West Fishing Charters
- Kona Fishing Charters
- Lakeside Marblehead Fishing Charters
- Marathon Fishing Charters
- Marco Island Fishing Charters
- Miami Fishing Charters
- Montauk Fishing Charters
- Morehead City Fishing Charters
- Naples Fishing Charters
- New Orleans Fishing Charters
- New Smyrna Beach Fishing Charters
- Ocean City Fishing Charters
- Orange Beach Fishing Charters
- Panama City Beach Fishing Charters
- Pensacola Fishing Charters
- Pompano Beach Fishing Charters
- Port Aransas Fishing Charters
- Port Orange Fishing Charters
- Rockport Fishing Charters
- San Diego Fishing Charters
- San Juan Fishing Charters
- Sarasota Fishing Charters
- South Padre Island Fishing Charters
- St. Augustine Fishing Charters
- St. Petersburg Fishing Charters
- Tampa Fishing Charters
- Tarpon Springs Fishing Charters
- Venice Fishing Charters
- Virginia Beach Fishing Charters
- West Palm Beach Fishing Charters
- Wilmington Fishing Charters
- Wrightsville Beach Fishing Charters