Inshore, Nearshore, River in Astoria
Ocean And Buoy 10 Salmon
4 Hr Reef/wreck


Deep Sea, Nearshore Fishing in St. Augustine
REEL OFFFSHORE ADVENTURE


Private Rocket Launch Trip Up Close
Deep Sea, Nearshore Fishing in San Francisco
Catch And Release Trip


Inshore, River Fishing in Astoria
Catch And Release Sturgeon

Deep Sea Fishing in San Francisco
Farallon Lingcod/Rock Fish

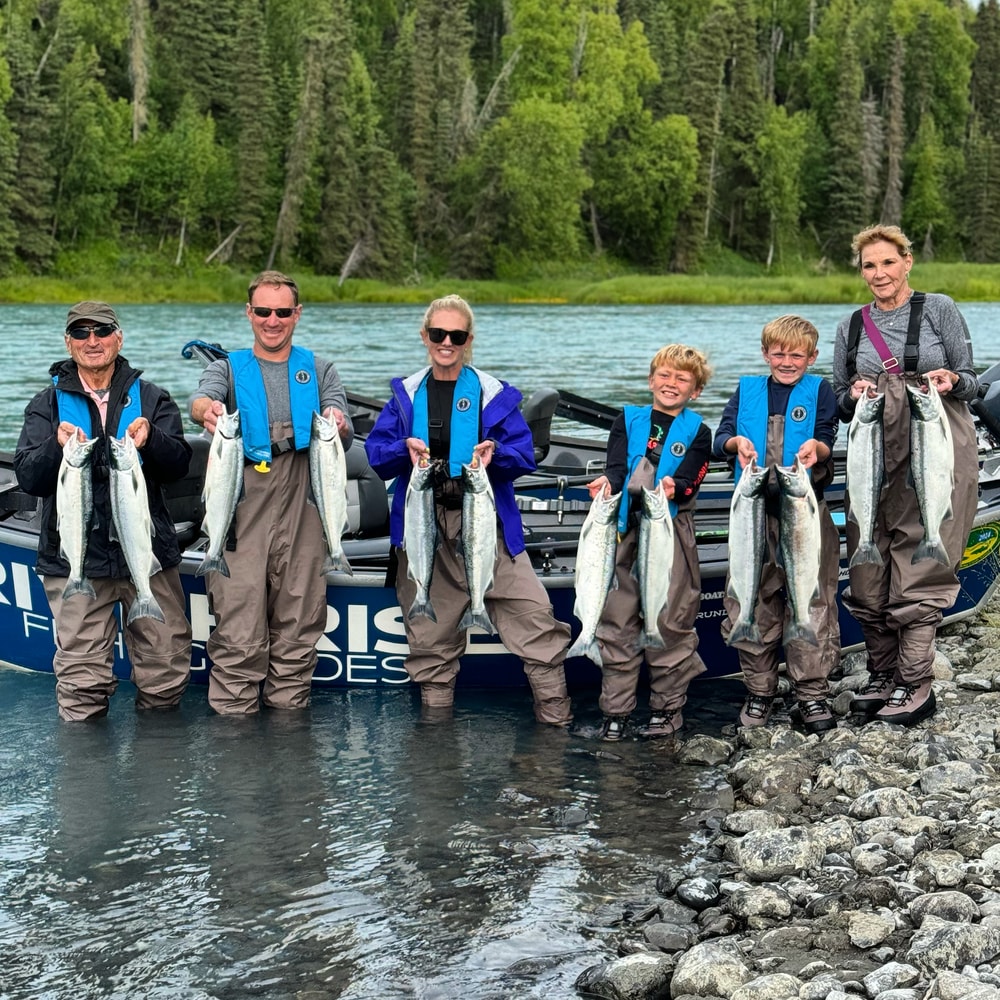
Kenai & Kasilof Sockeye Fishing
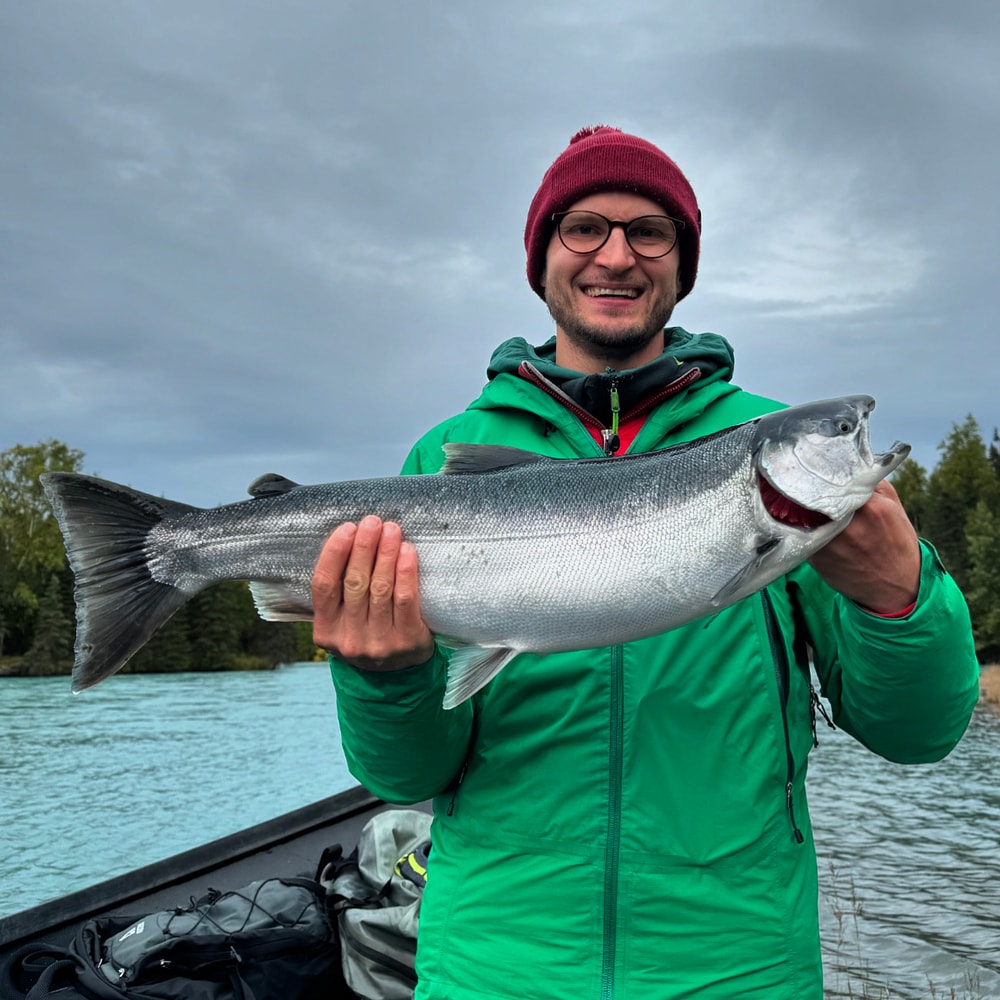
Kenai & Kasilof Silver Fishing Trip

Inshore, Nearshore Fishing in San Francisco
San Francisco Bay Fishing Trips
We started Captain Experiences to make it easy to book fishing and hunting guides around the world. With over 2,000 Damn Good Guides, our platform makes finding and booking a trip seamless. Head here to check out our trips.
Fishing is a classic outdoor pastime for many Americans, and its growing popularity has led to a trending sector within the tourism industry known as fishing tourism. While many enjoy afternoons fishing at local ponds, rivers, and lakes near their home, amateur and professional anglers alike increasingly travel to top fishing destinations across the country, boasting picturesque views and potential for impressive catches.
In most cases, travelers must obtain a non-resident fishing license to go fishing out-of-state. These licenses are usually sold by the state’s wildlife department, and the revenue generated from fishing licenses provides funding for conservation and wildlife restoration programs. For example, the Wyoming Game and Fish Department issues fishing and hunting licenses for the state, but also oversees wildlife habitat management areas and provides conservation education at public schools and colleges. This financial model establishes a symbiotic relationship between wildlife conservation initiatives and recreational anglers.
Trends in Fishing Tourism
Out-of-state residents are accounting for a growing share of fishing licenses

Source: Captain Experiences analysis of U.S. Fish & Wildlife Service data
From the late 1960s through the 1980s, the share of annual state fishing licenses held by non-residents remained steady at 15% or less each year. However, since the 1990s, non-resident fishing licenses across the U.S. have been steadily increasing as more Americans travel to fish. And after a brief decline due to COVID-19, the proportion of licenses held by non-residents spiked to a record-setting 22.3% in 2022, or nearly 9.4 million total.
The rise in non-resident licenses not only represents steady growth in the fishing tourism industry, but also a boon for wildlife conservation and management. Often, non-resident fishing licenses cost more than resident fishing licenses, and because of this, fishing tourism can have an outsized positive impact on conservation efforts. Moreover, the U.S. Fish and Wildlife Service (FWS) allots federal funding to state wildlife agencies based on the number of licenses sold in each state and has provided more than $25 billion to state and tribal fish and wildlife agencies since 1937. This funding directly supports hunting and fishing education, wildlife management, research, habitat restoration, and conservation efforts, among other environmental initiatives.
Local Economic Impact of Recreational Fishing
Recreational fishing supports a growing number of local jobs and business sales

Source: Captain Experiences analysis of National Oceanic and Atmospheric Administration (NOAA) data
Funding for state conservation and wildlife restoration programs is not the only benefit resulting from the increase in fishing tourism. Like other forms of tourism, travelers from out of state support fishing destinations’ economies by patronizing local businesses. The number of jobs and local business sales supported by recreational fishing has been on the rise in recent years. The National Oceanic and Atmospheric Administration (NOAA) estimates that in 2018 recreational fishing directly and indirectly supported nearly 470,000 jobs and generated more than $83 billion (inflation-adjusted 2022 dollars) in local business sales across the U.S. In 2022, more than 690,000 jobs were supported, and nearly $138 billion in local business sales were generated, representing 47.2% and 65.1% growth from 2018, respectively.
Geographical Differences in Fishing Tourism
Florida, Montana, and Colorado lead the nation in non-resident fishing licenses

Source: Captain Experiences analysis of U.S. Fish & Wildlife Service data
Regionally, the Southeast U.S., Mountain West, and Alaska are the most popular travel destinations for anglers. However, several states in the Great Lakes region—including Wisconsin, Minnesota, and Michigan—also rank highly.
In the Southeast, Florida stands out with its diverse fishing opportunities, ranging from deep-sea fishing in the Gulf of Mexico to fly fishing in the Everglades. Florida sold the highest number of non-resident licenses, with 917,665 issued annually. The state's extensive coastline, numerous lakes, and warm climate make it a year-round fishing haven, drawing anglers from across the country. Other top fishing destinations in the Southeast include Tennessee and the Carolinas.
In the Mountain West, Montana and Colorado follow closely with 739,575 and 511,912 non-resident fishing licenses sold, respectively. Both states are celebrated for their pristine rivers and lakes, offering some of the best fly fishing in the world. Montana's Glacier National Park and Colorado's Rocky Mountain National Park attract anglers seeking quality fishing amidst mountain environments. Similarly, neighboring Idaho and Wyoming are also among the top-ranked states for fishing tourism.
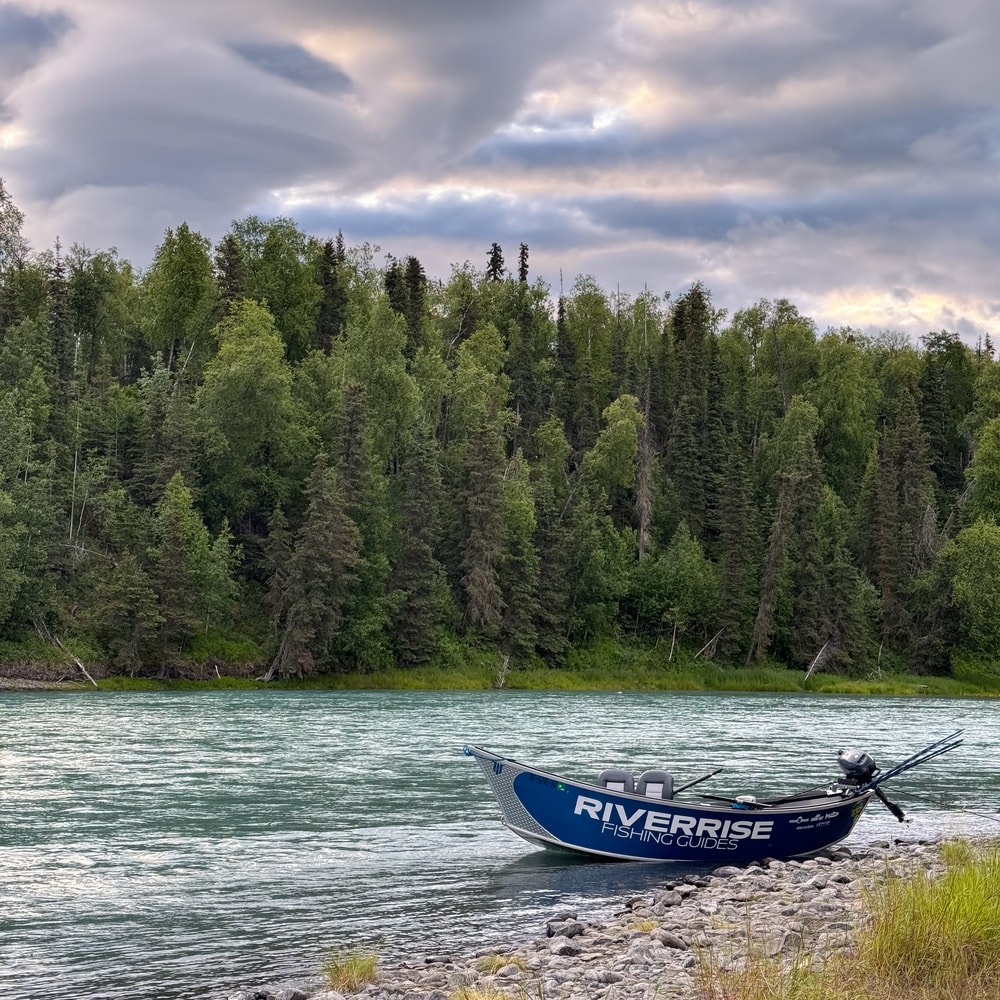
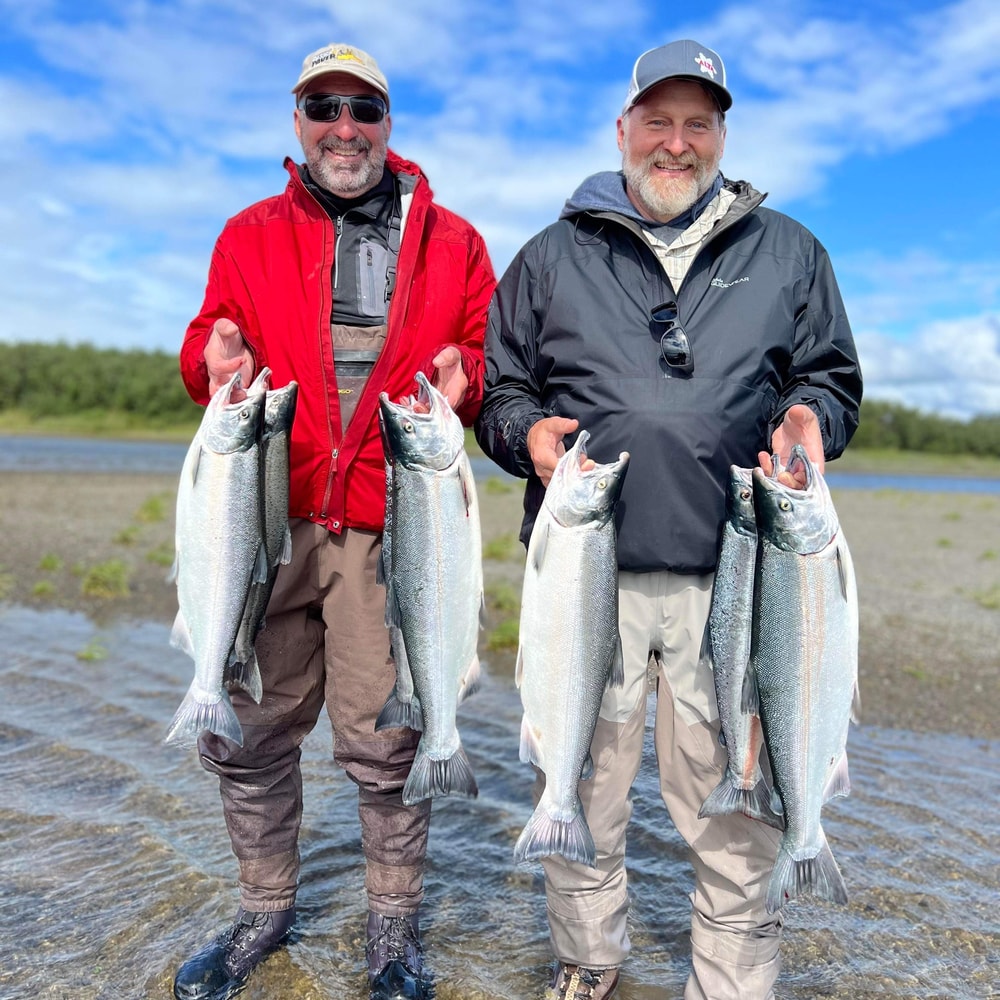
Alaska, ranking fourth in non-resident fishing licenses sold, has long been a prominent destination for fishing. The state issued 492,860 non-resident licenses annually, generating approximately $15.8 million in revenue, which constitutes 75.6% of its total fishing license revenue. Alaska's unique fishing opportunities, such as salmon runs and deep-sea fishing in the Pacific, make it a coveted destination for avid anglers. The state's vast wilderness and pristine environments provide an unparalleled backdrop for nearly any outdoor activity.
Below is a complete breakdown of the most popular fishing travel destinations in the U.S. The analysis was conducted by Captain Experiences, a fishing and hunting guide reservation platform, using data from the U.S. Fish & Wildlife Service. For more information, refer to the methodology section.
The Top States for Fishing Tourism

Photo Credit: Kim McCormick / Shutterstock
15. Oregon
- Annual fishing licenses issued to non-residents: 217,658
- Annual fishing license revenue from non-residents: $8,614,226
- Share of annual fishing licenses issued to non-residents: 22.1%
- Share of annual fishing license revenue from non-residents: 25.7%

Photo Credit: Marcus E Jones / Shutterstock
14. Georgia
- Annual fishing licenses issued to non-residents: 221,189
- Annual fishing license revenue from non-residents: $3,318,536
- Share of annual fishing licenses issued to non-residents: 13.8%
- Share of annual fishing license revenue from non-residents: 21.1%

Photo Credit: CactusPilot / Shutterstock
13. New Mexico
- Annual fishing licenses issued to non-residents: 229,300
- Annual fishing license revenue from non-residents: $2,786,201
- Share of annual fishing licenses issued to non-residents: 29.9%
- Share of annual fishing license revenue from non-residents: 33.4%

Photo Credit: LeeAnn White / Shutterstock
12. South Carolina
- Annual fishing licenses issued to non-residents: 230,871
- Annual fishing license revenue from non-residents: $2,321,338
- Share of annual fishing licenses issued to non-residents: 28.6%
- Share of annual fishing license revenue from non-residents: 36.5%

Photo Credit: Amanda Allard-Korell / Shutterstock
11. Wyoming
- Annual fishing licenses issued to non-residents: 231,511
- Annual fishing license revenue from non-residents: $6,617,055
- Share of annual fishing licenses issued to non-residents: 71.5%
- Share of annual fishing license revenue from non-residents: 77.1%

Photo Credit: CSNafzger / Shutterstock
10. Idaho
- Annual fishing licenses issued to non-residents: 247,744
- Annual fishing license revenue from non-residents: $10,241,245
- Share of annual fishing licenses issued to non-residents: 28.0%
- Share of annual fishing license revenue from non-residents: 55.8%

Photo Credit: Jeff Zarinelli / Shutterstock
9. Michigan
- Annual fishing licenses issued to non-residents: 252,180
- Annual fishing license revenue from non-residents: $9,275,692
- Share of annual fishing licenses issued to non-residents: 21.2%
- Share of annual fishing license revenue from non-residents: 31.1%

Photo Credit: Dee Browning / Shutterstock
8. North Carolina
- Annual fishing licenses issued to non-residents: 275,808
- Annual fishing license revenue from non-residents: $6,324,127
- Share of annual fishing licenses issued to non-residents: 29.3%
- Share of annual fishing license revenue from non-residents: 22.1%

Photo Credit: Dan Thornberg / Shutterstock
7. Minnesota
- Annual fishing licenses issued to non-residents: 377,439
- Annual fishing license revenue from non-residents: $13,376,465
- Share of annual fishing licenses issued to non-residents: 23.6%
- Share of annual fishing license revenue from non-residents: 34.8%

Photo Credit: Bonita R. Cheshier / Shutterstock
6. Tennessee
- Annual fishing licenses issued to non-residents: 388,475
- Annual fishing license revenue from non-residents: $13,353,929
- Share of annual fishing licenses issued to non-residents: 23.5%
- Share of annual fishing license revenue from non-residents: 30.6%

Photo Credit: Jennifer Tepp / Shutterstock
5. Wisconsin
- Annual fishing licenses issued to non-residents: 448,237
- Annual fishing license revenue from non-residents: $12,146,592
- Share of annual fishing licenses issued to non-residents: 25.3%
- Share of annual fishing license revenue from non-residents: 35.1%

Photo Credit: Galyna Andrushko / Shutterstock
4. Alaska
- Annual fishing licenses issued to non-residents: 492,860
- Annual fishing license revenue from non-residents: $15,817,365
- Share of annual fishing licenses issued to non-residents: 70.8%
- Share of annual fishing license revenue from non-residents: 75.6%

Photo Credit: Kris Wiktor / Shutterstock
3. Colorado
- Annual fishing licenses issued to non-residents: 511,912
- Annual fishing license revenue from non-residents: $12,335,290
- Share of annual fishing licenses issued to non-residents: 38.9%
- Share of annual fishing license revenue from non-residents: 41.2%

Photo Credit: Ansel B / Shutterstock
2. Montana
- Annual fishing licenses issued to non-residents: 739,575
- Annual fishing license revenue from non-residents: $16,647,712
- Share of annual fishing licenses issued to non-residents: 50.0%
- Share of annual fishing license revenue from non-residents: 72.5%

Photo Credit: The Toidi / Shutterstock
1. Florida
- Annual fishing licenses issued to non-residents: 917,665
- Annual fishing license revenue from non-residents: $25,753,980
- Share of annual fishing licenses issued to non-residents: 36.8%
- Share of annual fishing license revenue from non-residents: 54.4%
Methodology
Researchers analyzed data from the U.S. Fish & Wildlife Service’s 2024 Hunting & Fishing Licenses Data. The latest licensing data is for apportionment year 2024, which reflects license sales that occurred in 2022. In order to determine the most popular fishing travel destinations in the U.S., the researchers calculated the number of fishing licenses, tags, permits, and stamps held by out-of-state residents. In the event of a tie, the location with the greater total revenue generated from licenses, tags, permits, and stamps held by out-of-state residents was ranked higher. The data only includes paid licenses that meet the requirements of the Dingell-Johnson Sport Fish Restoration Act and do not include licenses issued for free or where individuals are not required to have any license. Additionally, anglers may hold licenses from multiple states simultaneously, and therefore, these calculations do not represent the number of actively licensed anglers.
References
- Wyoming Game & Fish Department. (n.d.). Conserving Wildlife, Serving People. Retrieved on June 26, 2024 from https://wgfd.wyo.gov/.
- Lane, J. (2024, May 16). States Where Fishing Is Growing Most In Popularity. Captain Experiences. Retrieved on June 26, 2024 from https://captainexperiences.com/blog/states-where-fishing-growing-most-in-popularity.
- U.S. Fish and Wildlife Service. (2023). Fiscal Year 2023 The Interior Budget in Brief U.S. Fish and Wildlife Service. Retrieved on June 26, 2024 from https://www.doi.gov/sites/doi.gov/files/fy2023-bib-fws-508.pdf.
- Captain Experiences. (n.d.). Wyoming Fishing Guides. Retrieved on June 26, 2024 from https://captainexperiences.com/locations/wyoming.
- Captain Experiences. (n.d.). Alaska Fishing Guides. Retrieved on June 26, 2024 from https://captainexperiences.com/locations/alaska.
- Captain Experiences. (n.d.). California Fishing Charters. Retrieved on June 26, 2024 from https://captainexperiences.com/locations/california.
- U.S. Fish & Wildlife Service. (2024). Office of Conservation Investment [Dataset]. Retrieved on June 18, 2024 from https://www.fws.gov/program/wildlife-and-sport-fish-restoration/apportionments-and-licenses-data.
Jake Lane
Updated on August 24, 2024

June 22, 2022

October 26, 2020

June 28, 2023

August 21, 2023

April 26, 2022
Related Articles

August 17, 2023

May 13, 2024

July 1, 2024
Featured Locations
- Fishing Charters Near Me
- Austin Fishing Guides
- Biloxi Fishing Charters
- Bradenton Fishing Charters
- Cabo San Lucas Fishing Charters
- Cancun Fishing Charters
- Cape Coral Fishing Charters
- Charleston Fishing Charters
- Clearwater Fishing Charters
- Corpus Christi Fishing Charters
- Crystal River Fishing Charters
- Dauphin Island Fishing Charters
- Daytona Beach Fishing Charters
- Destin Fishing Charters
- Fort Lauderdale Fishing Charters
- Fort Myers Fishing Charters
- Fort Walton Beach Fishing Charters
- Galveston Fishing Charters
- Gulf Shores Fishing Charters
- Hatteras Fishing Charters
- Hilton Head Fishing Charters
- Islamorada Fishing Charters
- Jacksonville Fishing Charters
- Jupiter Fishing Charters
- Key Largo Fishing Charters
- Key West Fishing Charters
- Kona Fishing Charters
- Lakeside Marblehead Fishing Charters
- Marathon Fishing Charters
- Marco Island Fishing Charters
- Miami Fishing Charters
- Montauk Fishing Charters
- Morehead City Fishing Charters
- Naples Fishing Charters
- New Orleans Fishing Charters
- New Smyrna Beach Fishing Charters
- Ocean City Fishing Charters
- Orange Beach Fishing Charters
- Panama City Beach Fishing Charters
- Pensacola Fishing Charters
- Pompano Beach Fishing Charters
- Port Aransas Fishing Charters
- Port Orange Fishing Charters
- Rockport Fishing Charters
- San Diego Fishing Charters
- San Juan Fishing Charters
- Sarasota Fishing Charters
- South Padre Island Fishing Charters
- St. Augustine Fishing Charters
- St. Petersburg Fishing Charters
- Tampa Fishing Charters
- Tarpon Springs Fishing Charters
- Venice Fishing Charters
- Virginia Beach Fishing Charters
- West Palm Beach Fishing Charters
- Wilmington Fishing Charters
- Wrightsville Beach Fishing Charters