
Inshore, Deep Sea Fishing in Nuevo Nayarit
8 Hrs Deep Sea Fishing NV
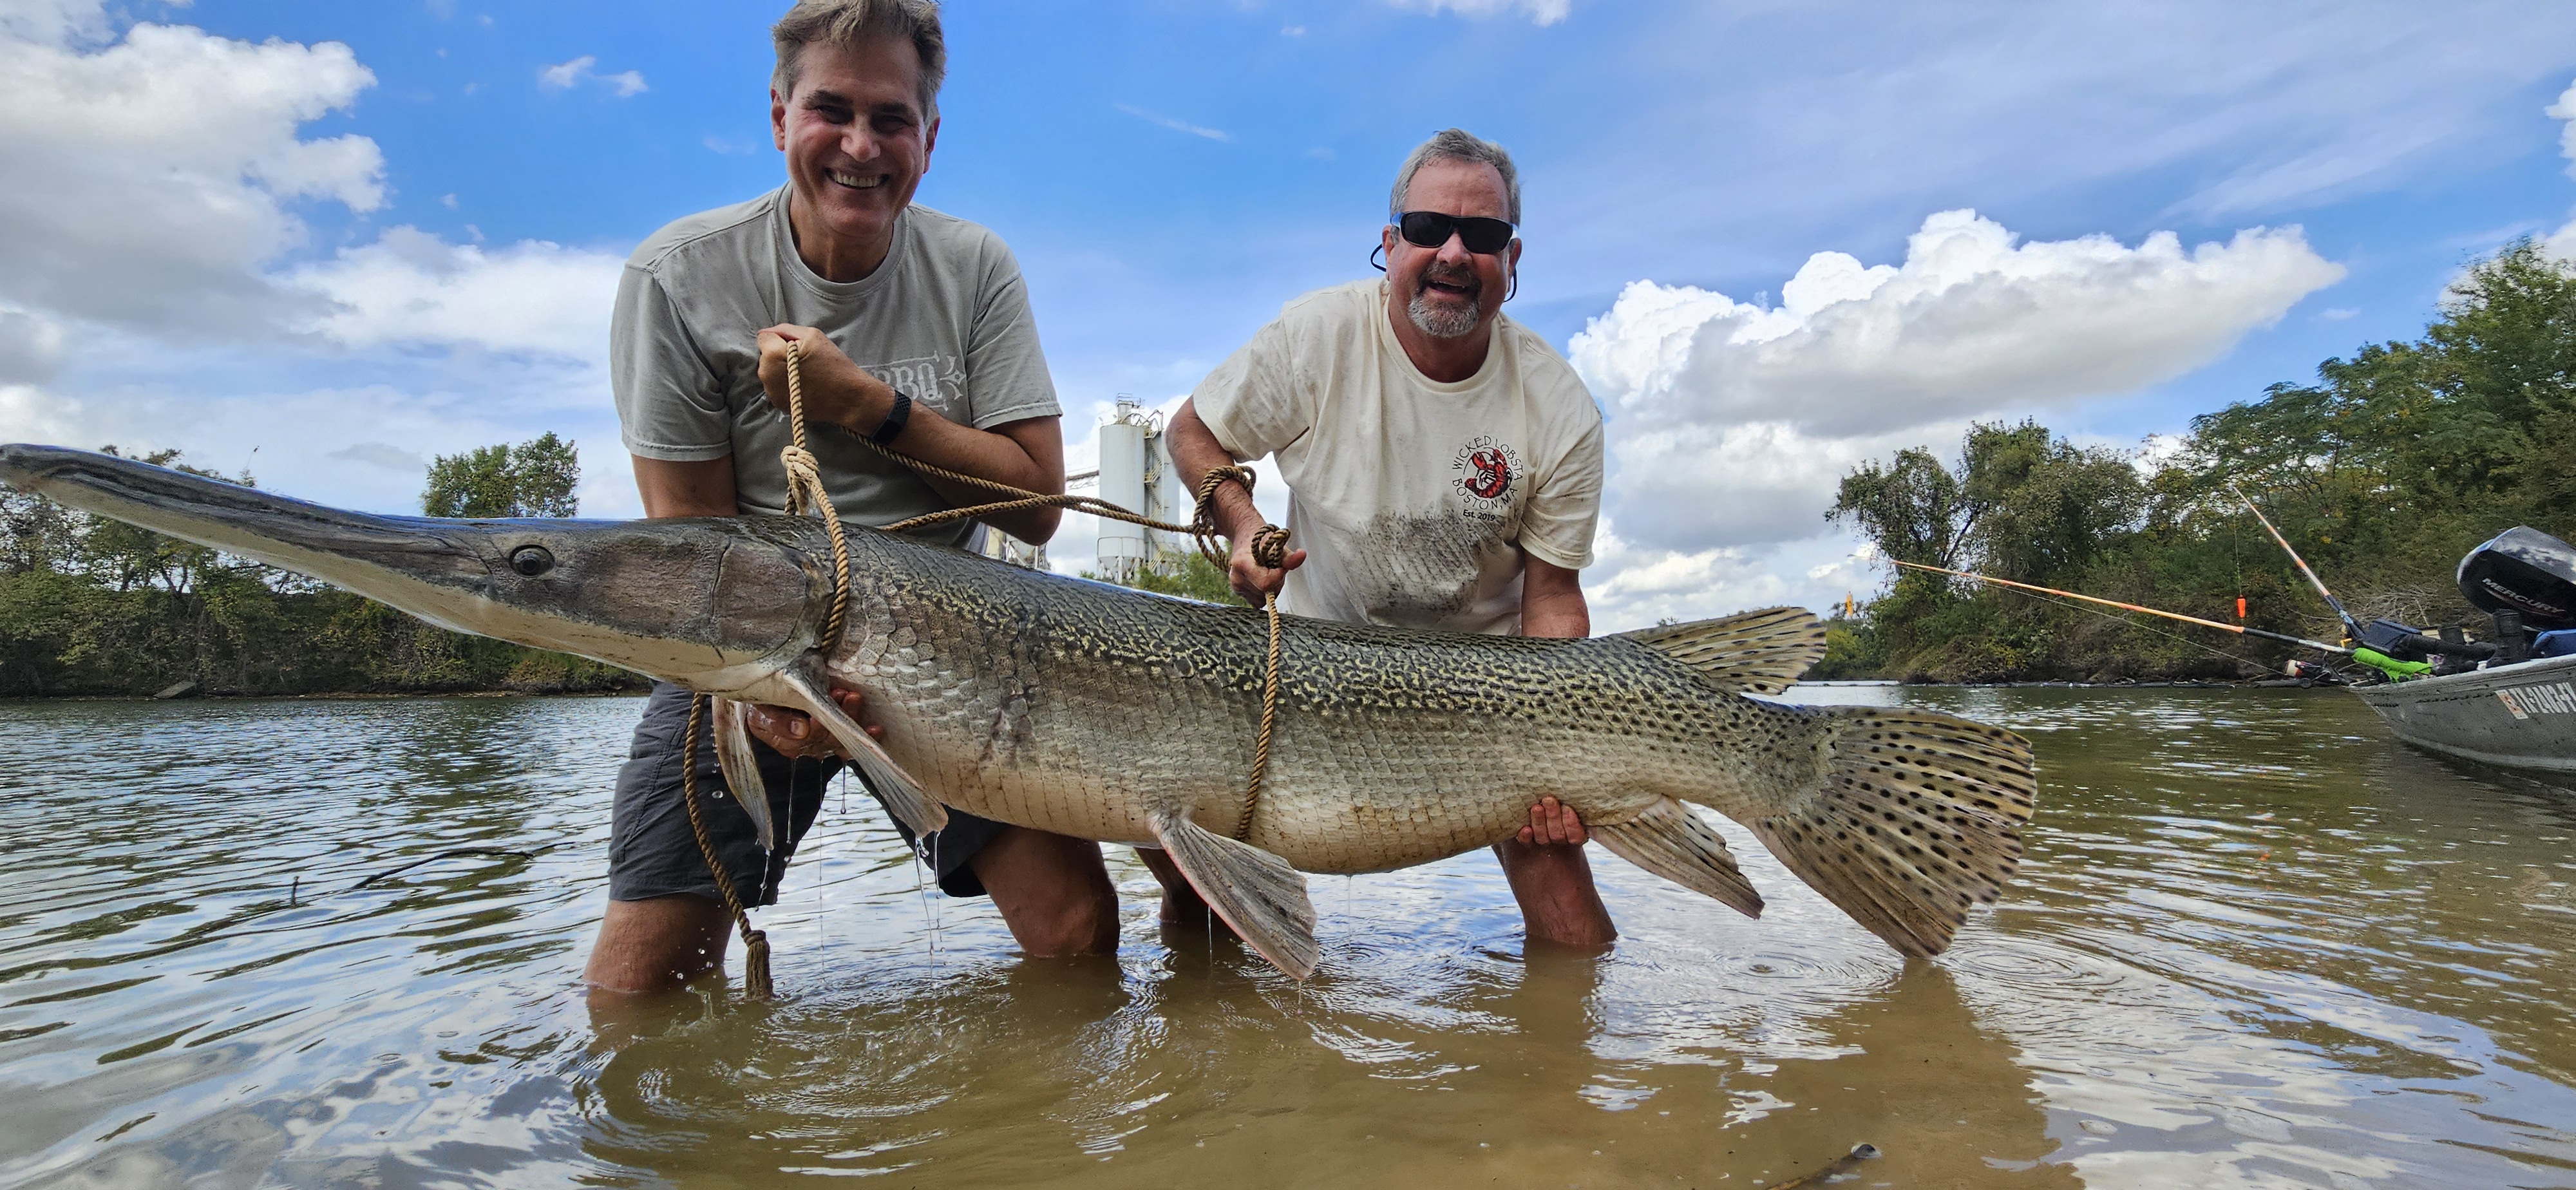
Fishing On Houston's Buffalo Bayou
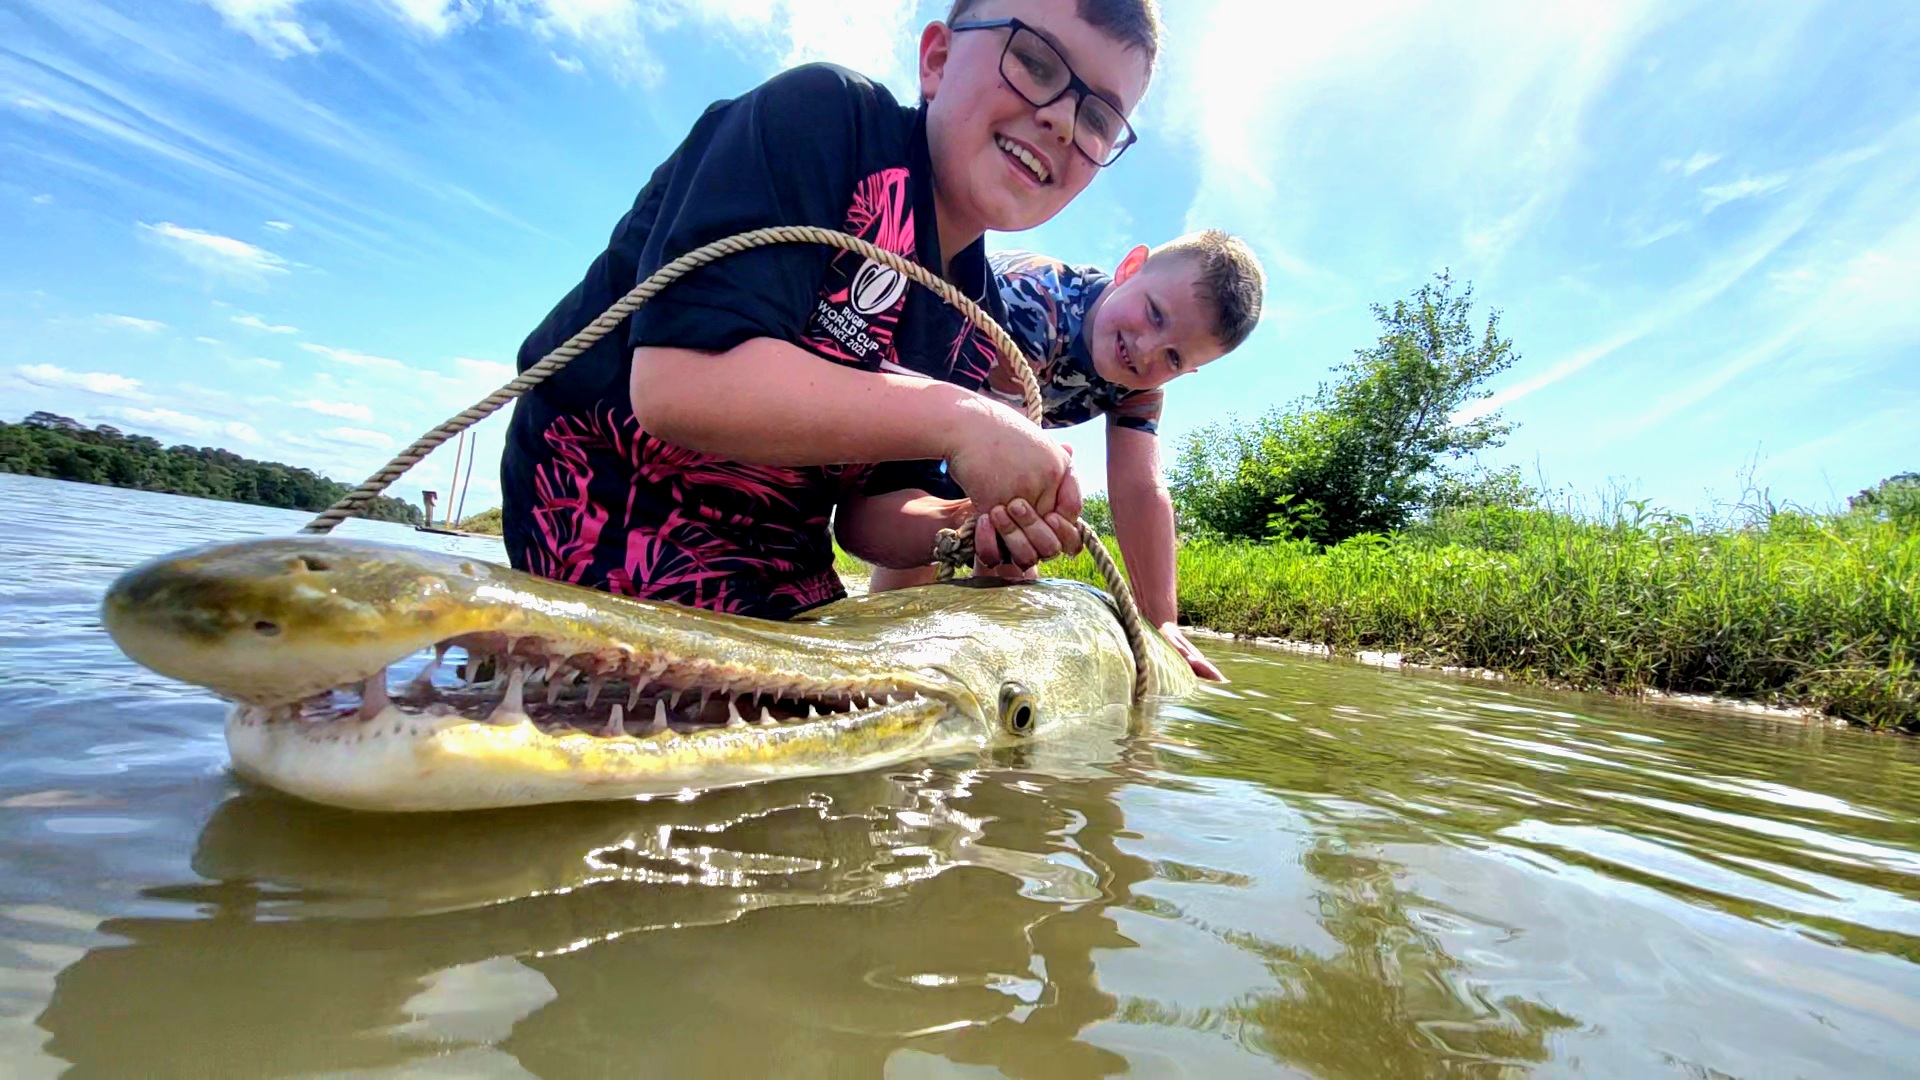
Fishing Houston's San Jacinto River
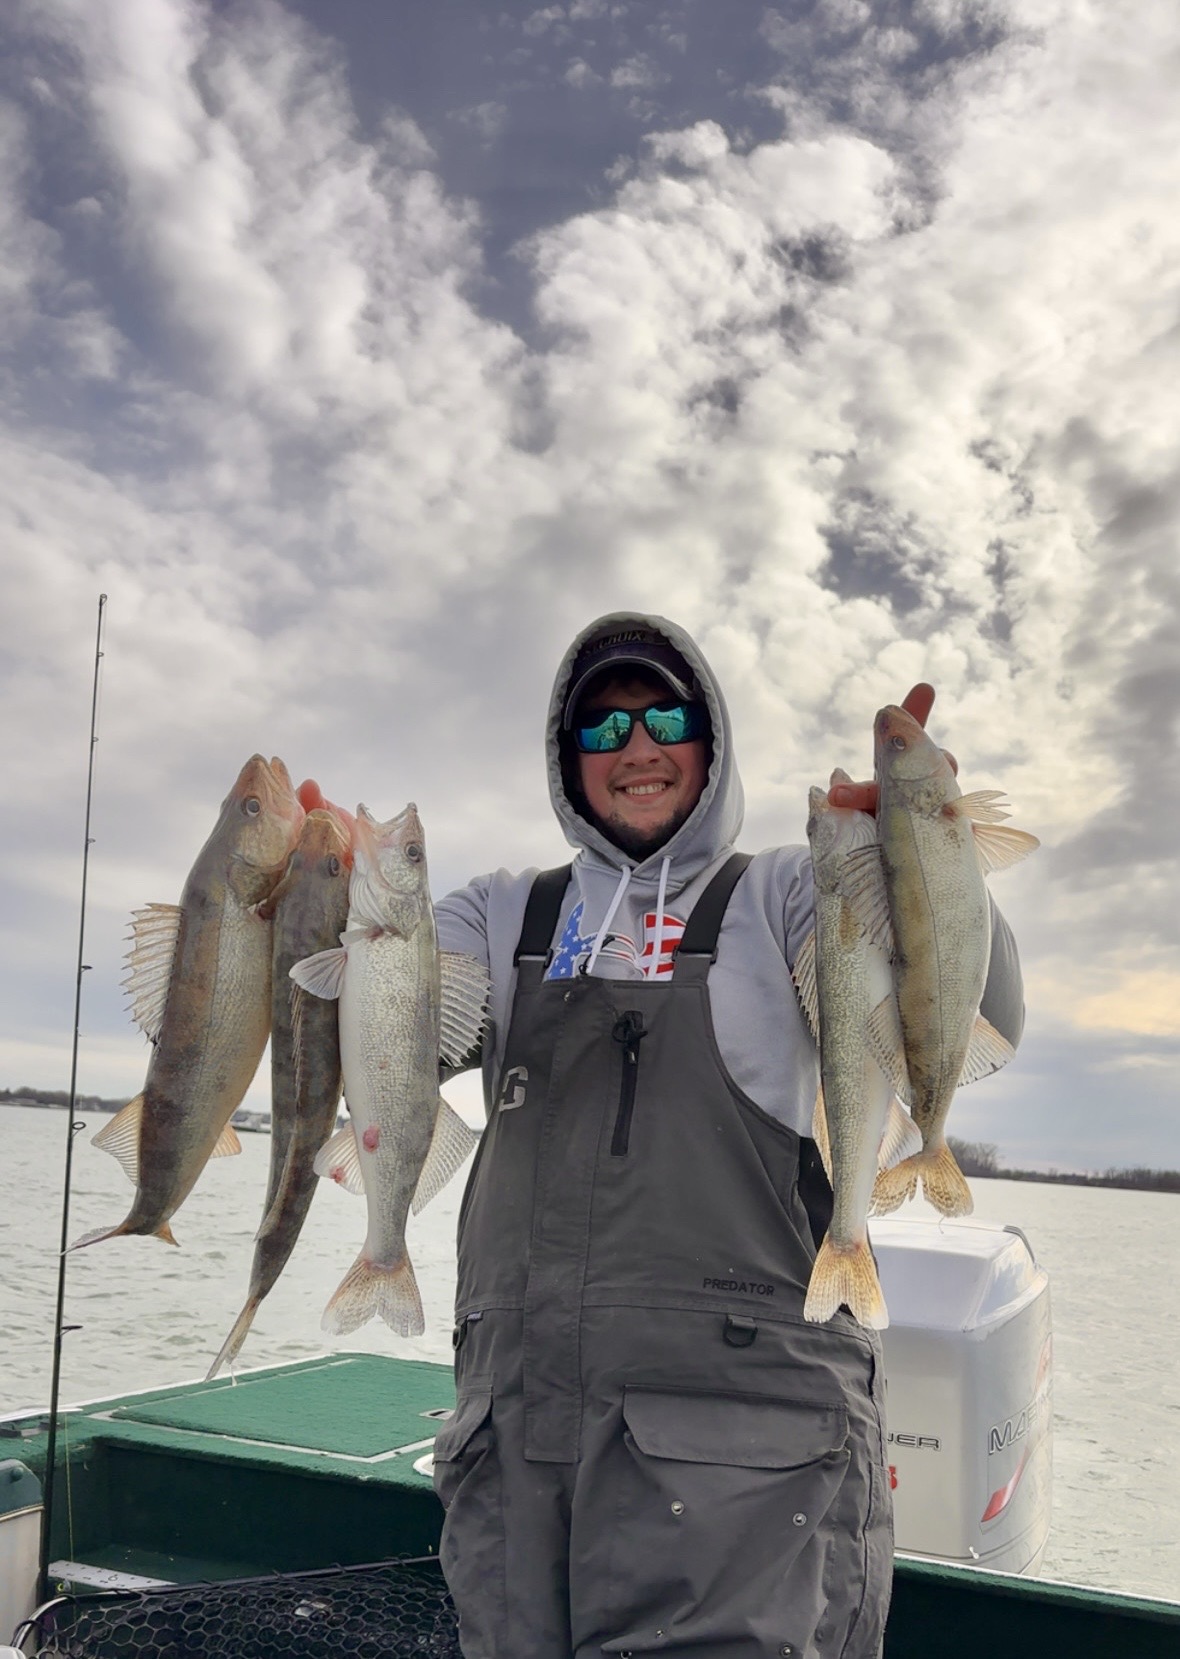
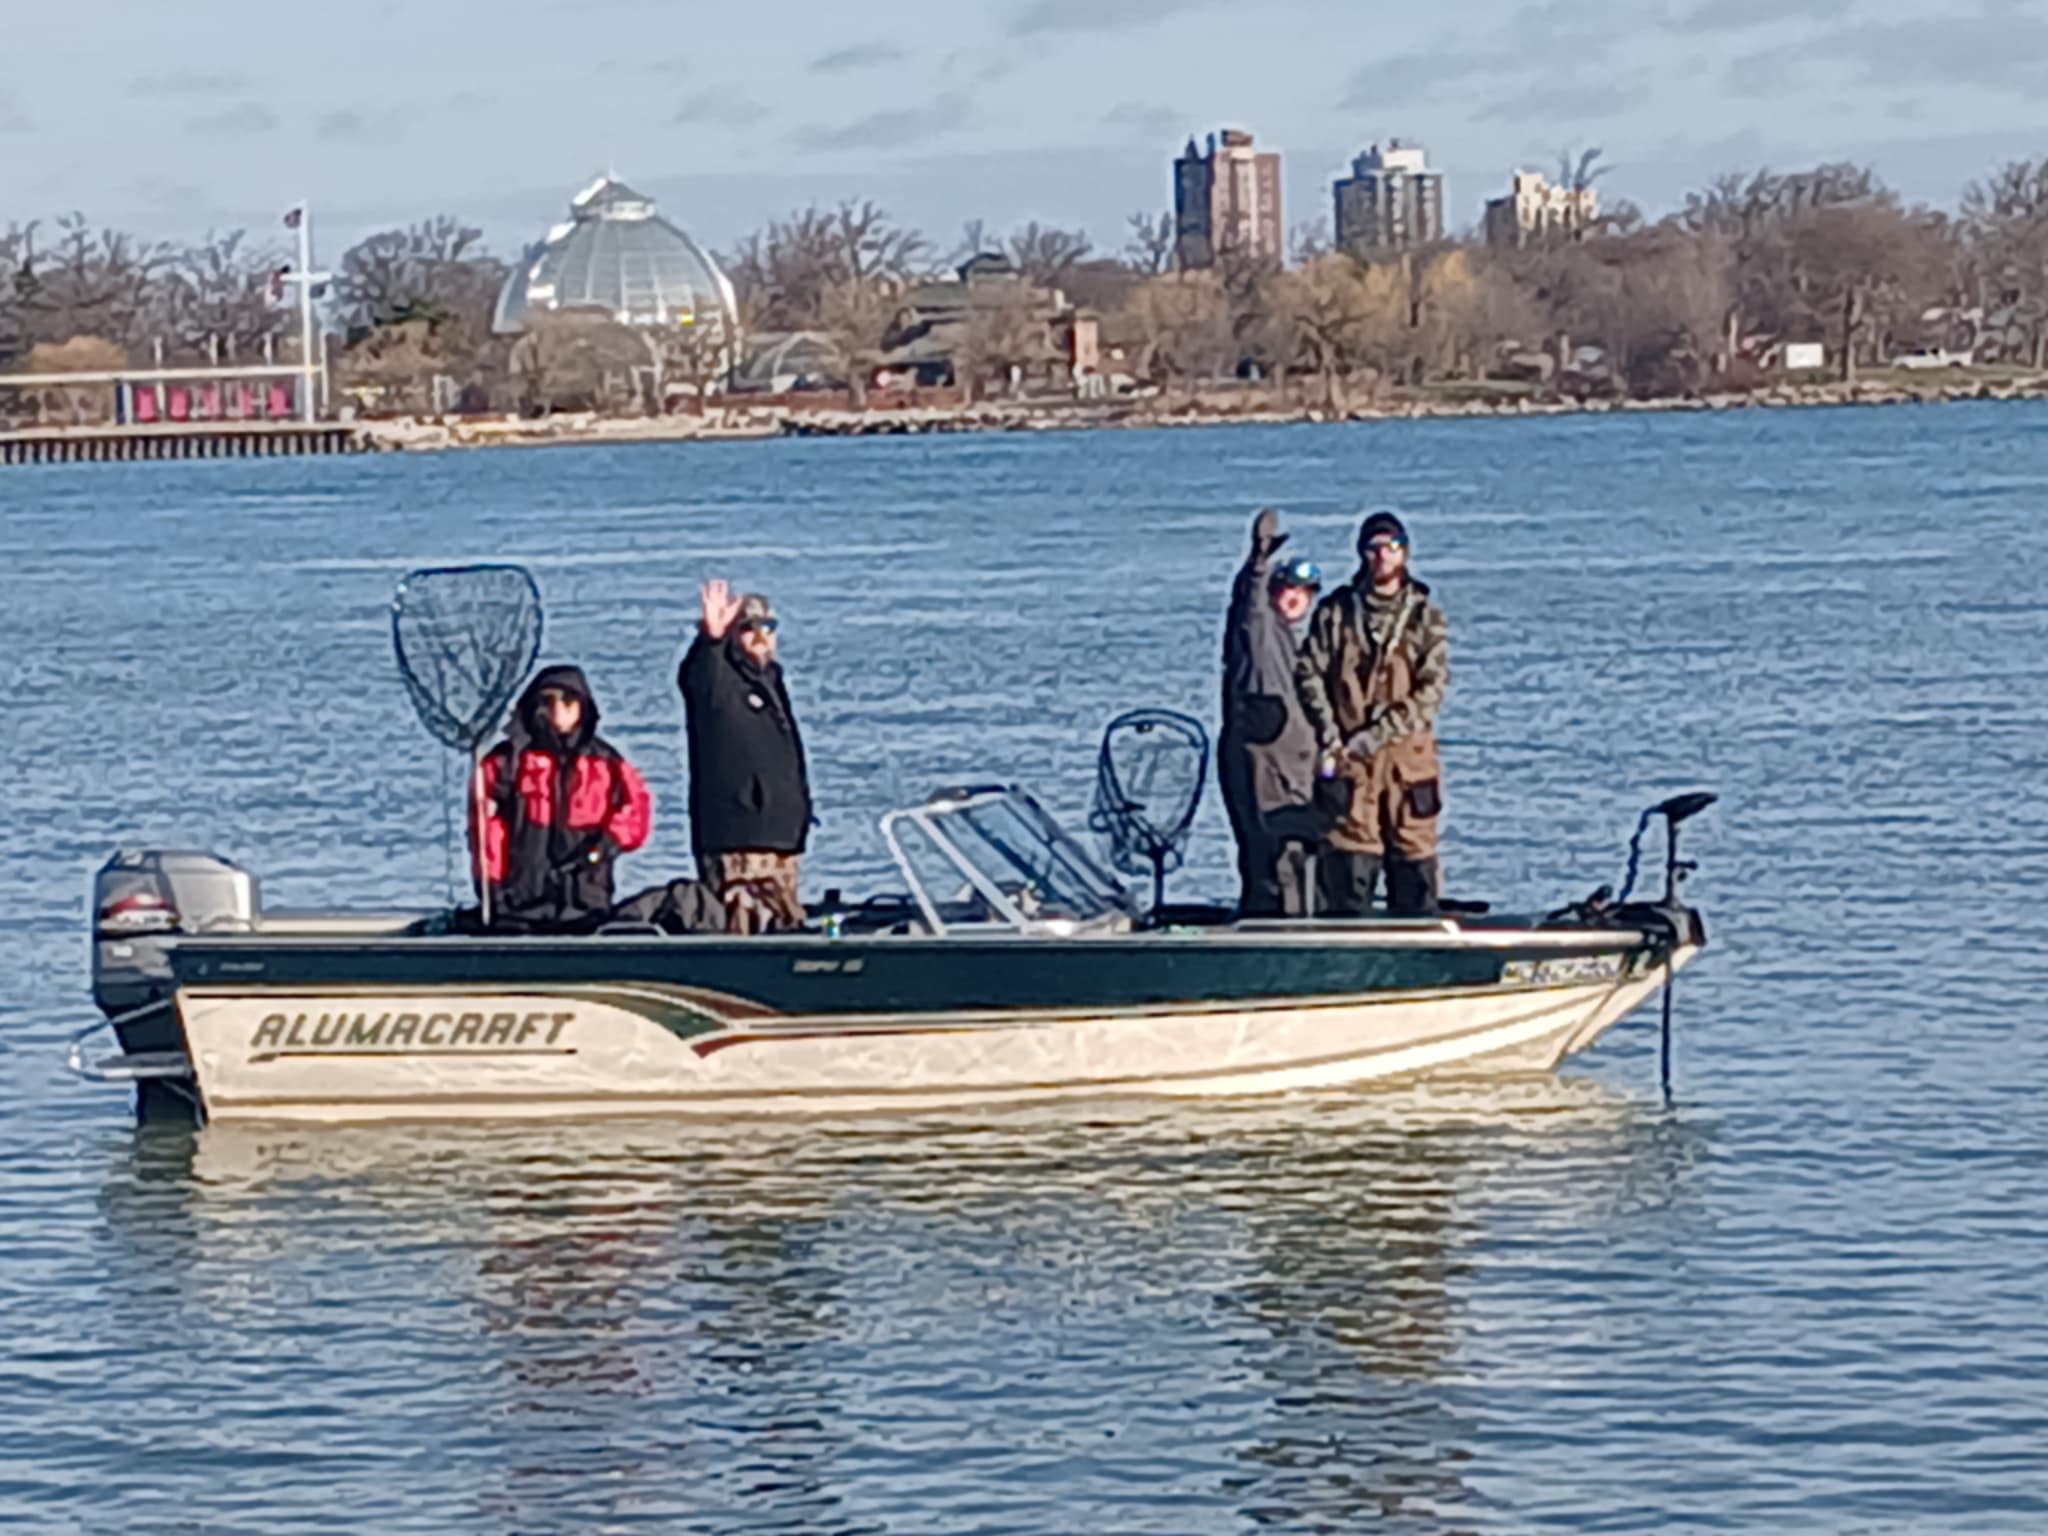
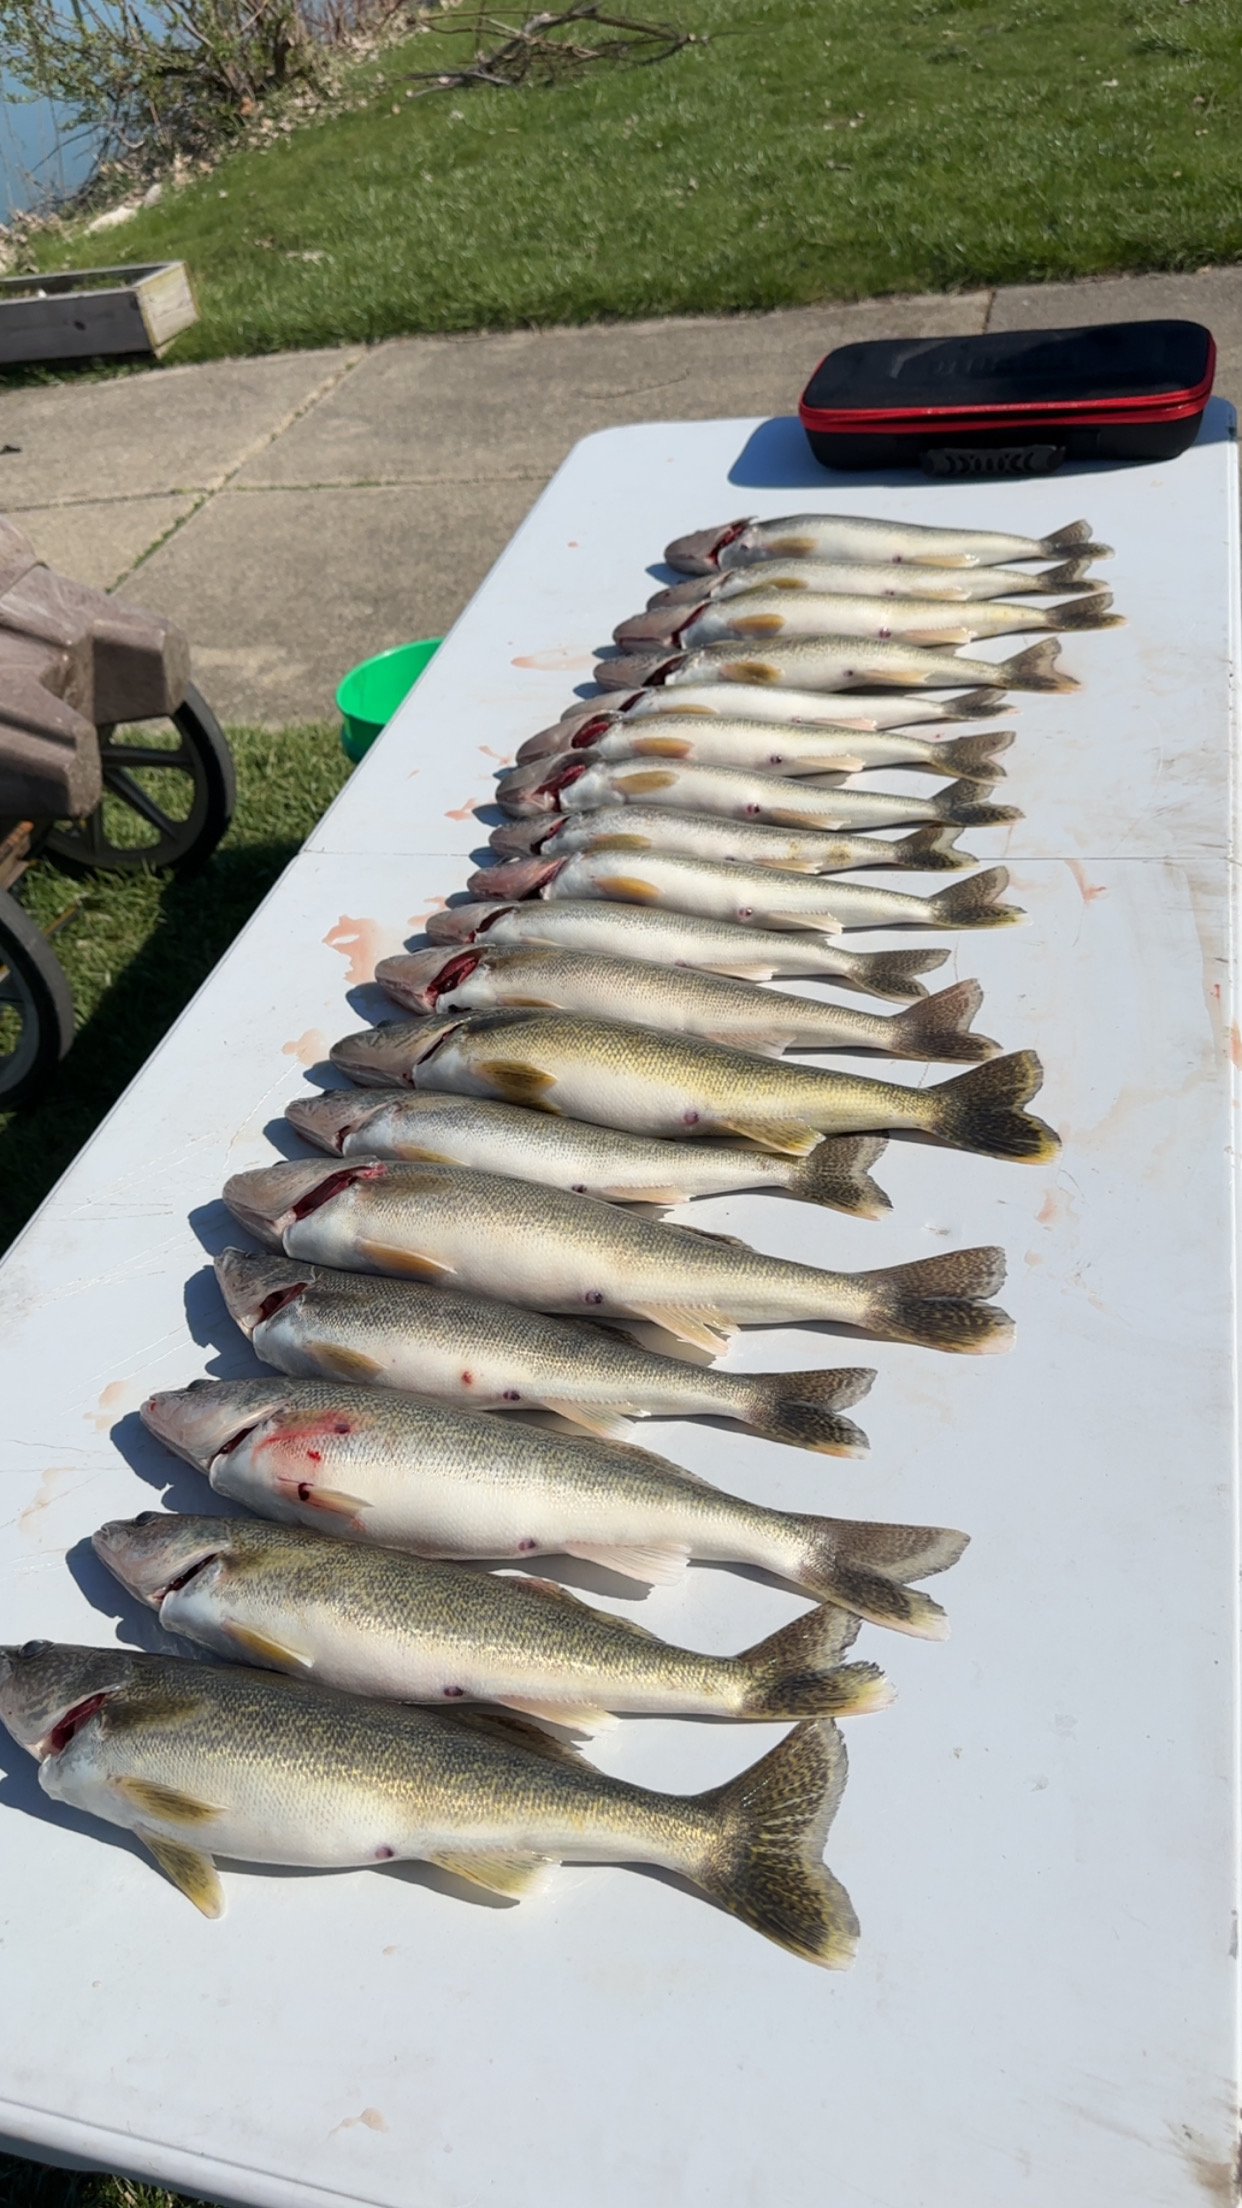
Detroit River Walleye Jigging

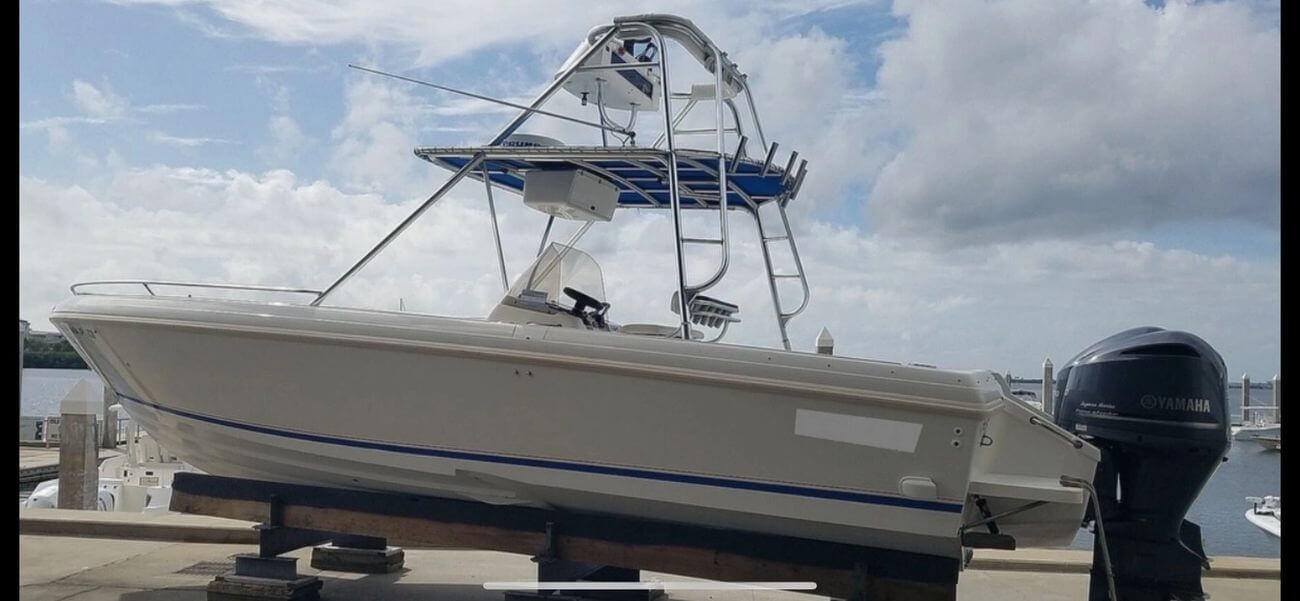
Deep Sea Fishing in Fort Myers Beach
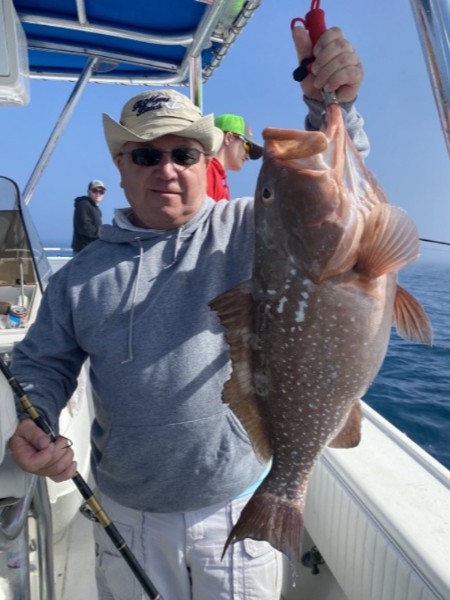
All-Day OFFSHORE FISHING
Inshore Fishing in Fort Myers Beach
Inshore Fishing 4 Hours
Bass Fishing
Catfishing Trip On James River
Nearshore Fishing in Frankfort
Frankfort Frenzy
Inshore, Deep Sea Fishing in Puerto Vallarta
8 Hr Deep Sea Fishing Trip PV
We started Captain Experiences to make it easy to book fishing and hunting guides around the world. With over 2,000 Damn Good Guides, our platform makes finding and booking a trip seamless. Head here to check out our trips.
With summer officially underway, Americans across the country are once again heading outside for leisure time in nature. Longer days and warmer temperatures make it easier to spend time outdoors. The end of the school year often sends families out on vacations and other excursions, while major holidays like the upcoming 4th of July allow nearly everyone to take time off to enjoy the outdoors.
In the heat of summer, one of the most popular ways to take in the outdoors is to hit the water. An estimated 100 million Americans—nearly one-third of the total U.S. population—go boating each year. According to the U.S. Bureau of Economic Analysis, recreational boating and fishing is the largest conventional outdoor recreation activity in the U.S., adding nearly $31 billion to the nation’s GDP in 2021.

Boating’s popularity has continued to grow in recent years, even amid an overall decline in the economic impact of outdoor recreation. Over the last half decade, the overall inflation-adjusted economic value of outdoor recreation has declined by 4%. This trend was driven in part by significant declines in sectors like “festivals and events” and “amusement and water parks” that were heavily impacted by closures and disruptions from the COVID-19 pandemic. The boating and fishing category, meanwhile, has seen its value increase by 6% over the same span, making the category one of eight to experience positive growth.
Gone Fishing
Positioned between the Gulf and the Atlantic, Key West offers a diverse range of fish species, making it a tropical paradise for anglers of all ages and experience levels. Our Key West fishing charters currently offer over 75 different trips in Key West, and you can see each trip’s reviews, photos, and guide bios to help you decide which one to book next.

The increased interest in boating during the pandemic may have contributed to a rise in the number of boating-related accidents as tracked by the U.S. Coast Guard. For most of the last two decades, boating accidents and injuries have generally trended downward over time. But from 2019 to 2020, the first year of the pandemic, the total number of reported boating accidents spiked by 26%, while boating-related injuries and deaths both increased by 25%.

While the number of boating accidents has fallen again since 2020, boating is an activity that carries some degree of risk, especially when boat operators behave irresponsibly. Operator-caused issues—such as inattentiveness, inexperience, excessive speed, and alcohol use—are among the top contributing factors to boating accidents in the U.S. In contrast, accidents caused by equipment, weather, or while loading and unloading the boat are much less common. Training for boat operators—or hiring an experienced boat captain—can help mitigate some of the most common risks. Among accidents where the operator’s level of boating instruction was known, 74% of deaths occurred on boats where the operator had not received any education.
Book With Captain Experiences
When you’re ready to book your next fishing trip, you can trust our licensed and insured, professional guides to help you safely unlock the outdoors. One of our most highly-rated destinations is Galveston, Texas. In our Galveston fishing charters guide, we cover everything you need to know—from pricing info and recent reviews to popular fish species.
Boat operators and passengers will also find that accidents are more common in some parts of the country than in others. Florida far outstrips any other state in the total number of boat deaths and boat accidents, but the Sunshine State also had the largest number of recreational boat registrations in each of the past five years, with an average of over 960,000 vessels registered each year. After adjusting for the number of vessels, however, Utah leads the nation with an accident rate of 105.9 per 100,000 vessels—nearly three times the national average—while Alaska leads all states with a boating fatality rate of 33.6 per 100,000 vessels, which is six times the overall U.S. rate.
The data used in this study is from the U.S. Coast Guard’s Recreational Boating Statistics, covering the five-year period from 2018–2022. To determine the states with the most boating-related fatalities, researchers at Captain Experiences, an online platform that helps people find and book fishing trips, calculated the average annual boating fatality rate per 100,000 registered recreational vessels in the state. In the event of a tie, the state with the higher average annual boating accident rate was ranked higher. Researchers also calculated the total number of deaths, number of accidents, and property damages over the five-year period. To improve the comparability of data across states, states that require registration of all watercraft without restrictions (such as all non-motorized vessels, canoes, kayaks, etc.) were not included.
Here are the states with the most boating-related fatalities.
States With the Highest Rates of Boating Fatalities

Photo Credit: Rachel Berkstresser / Shutterstock
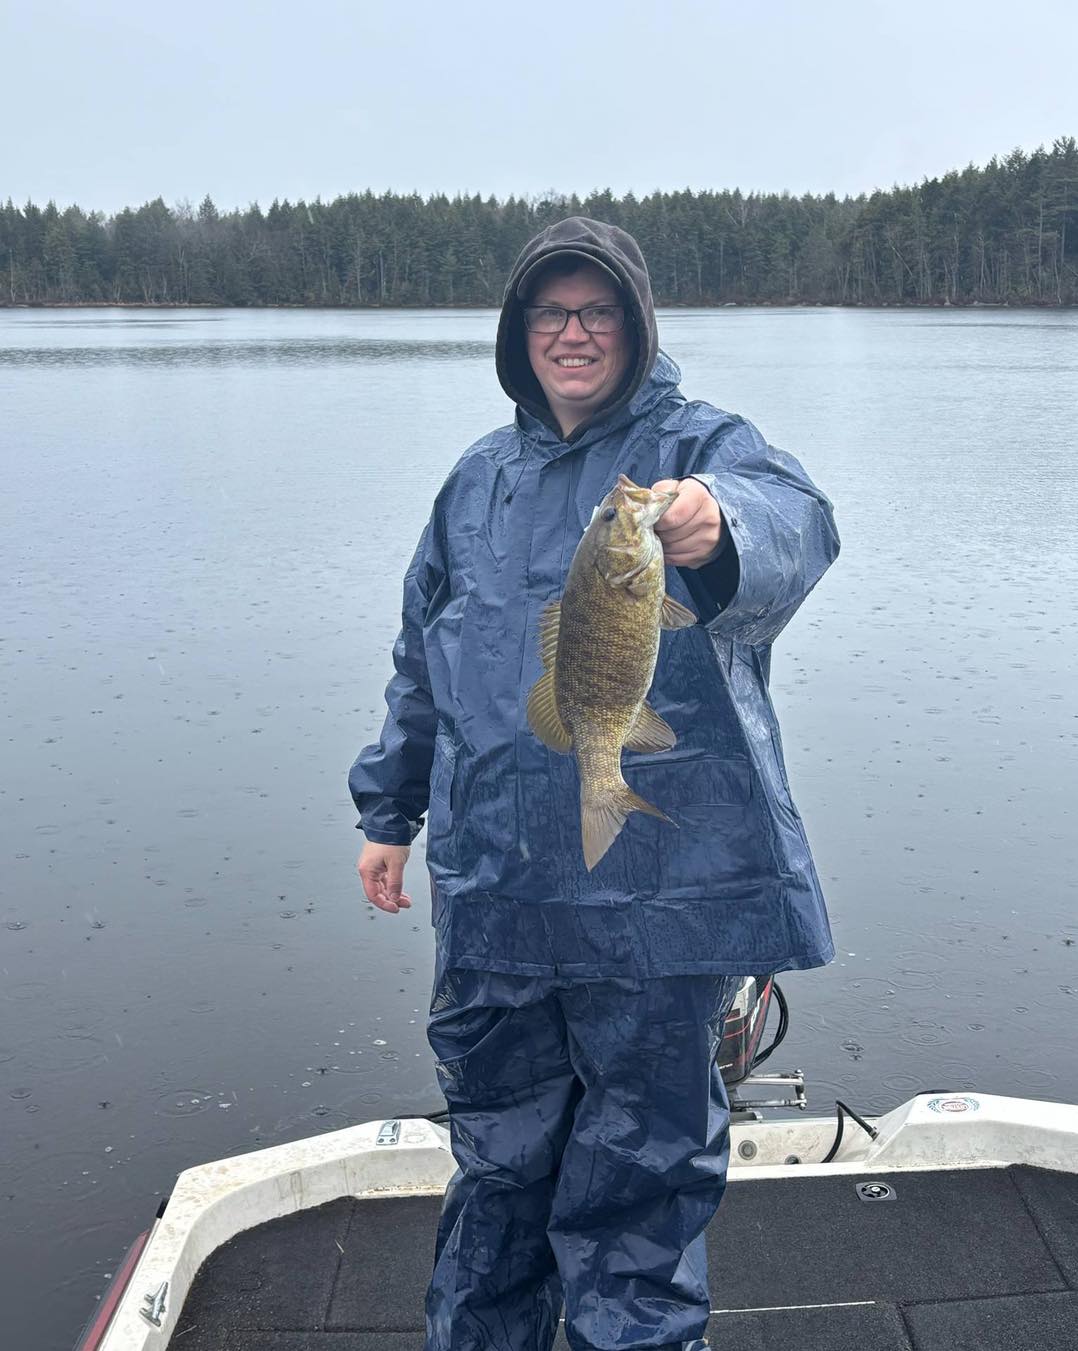
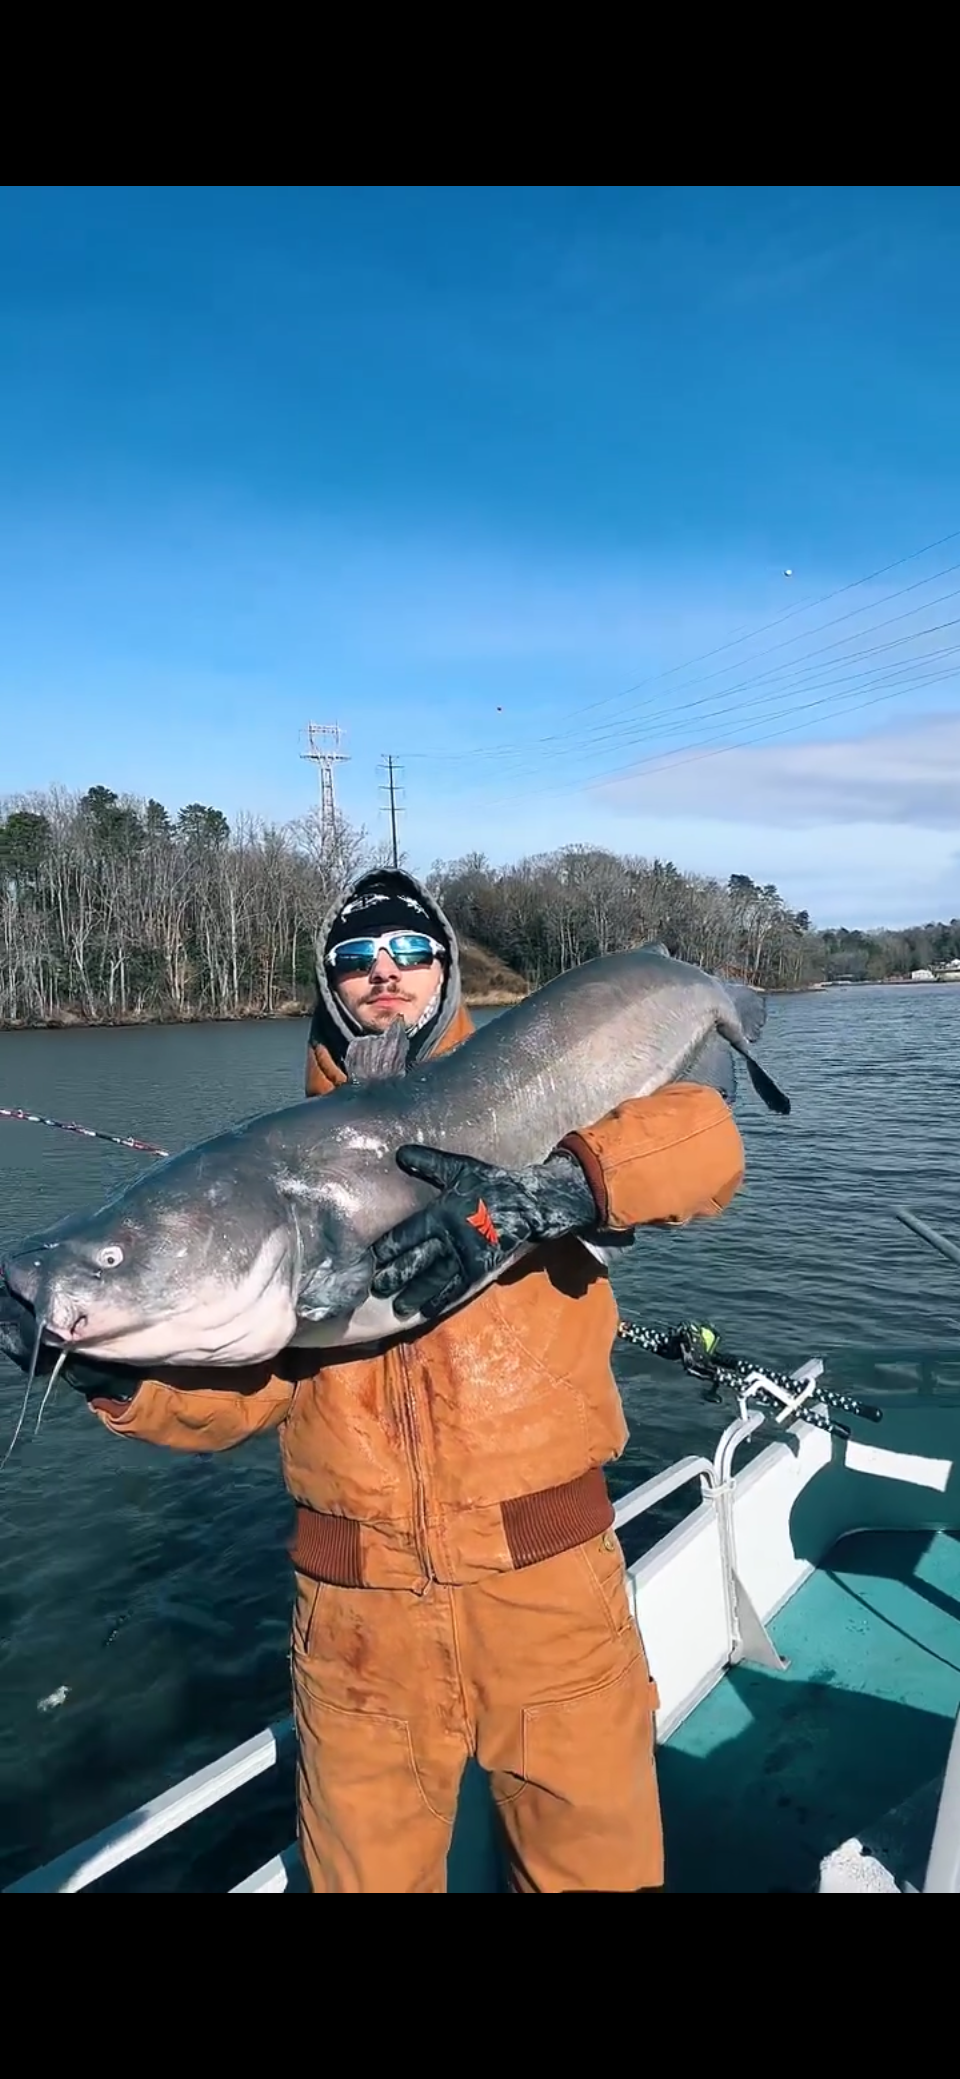
15. Virginia
- Average annual boating fatality rate: 7.6
- Average annual boating accident rate: 39.0
- Total number of deaths (2018–2022): 86
- Total number of accidents (2018–2022): 440
- Total property damages (2018–2022): $3,960,397

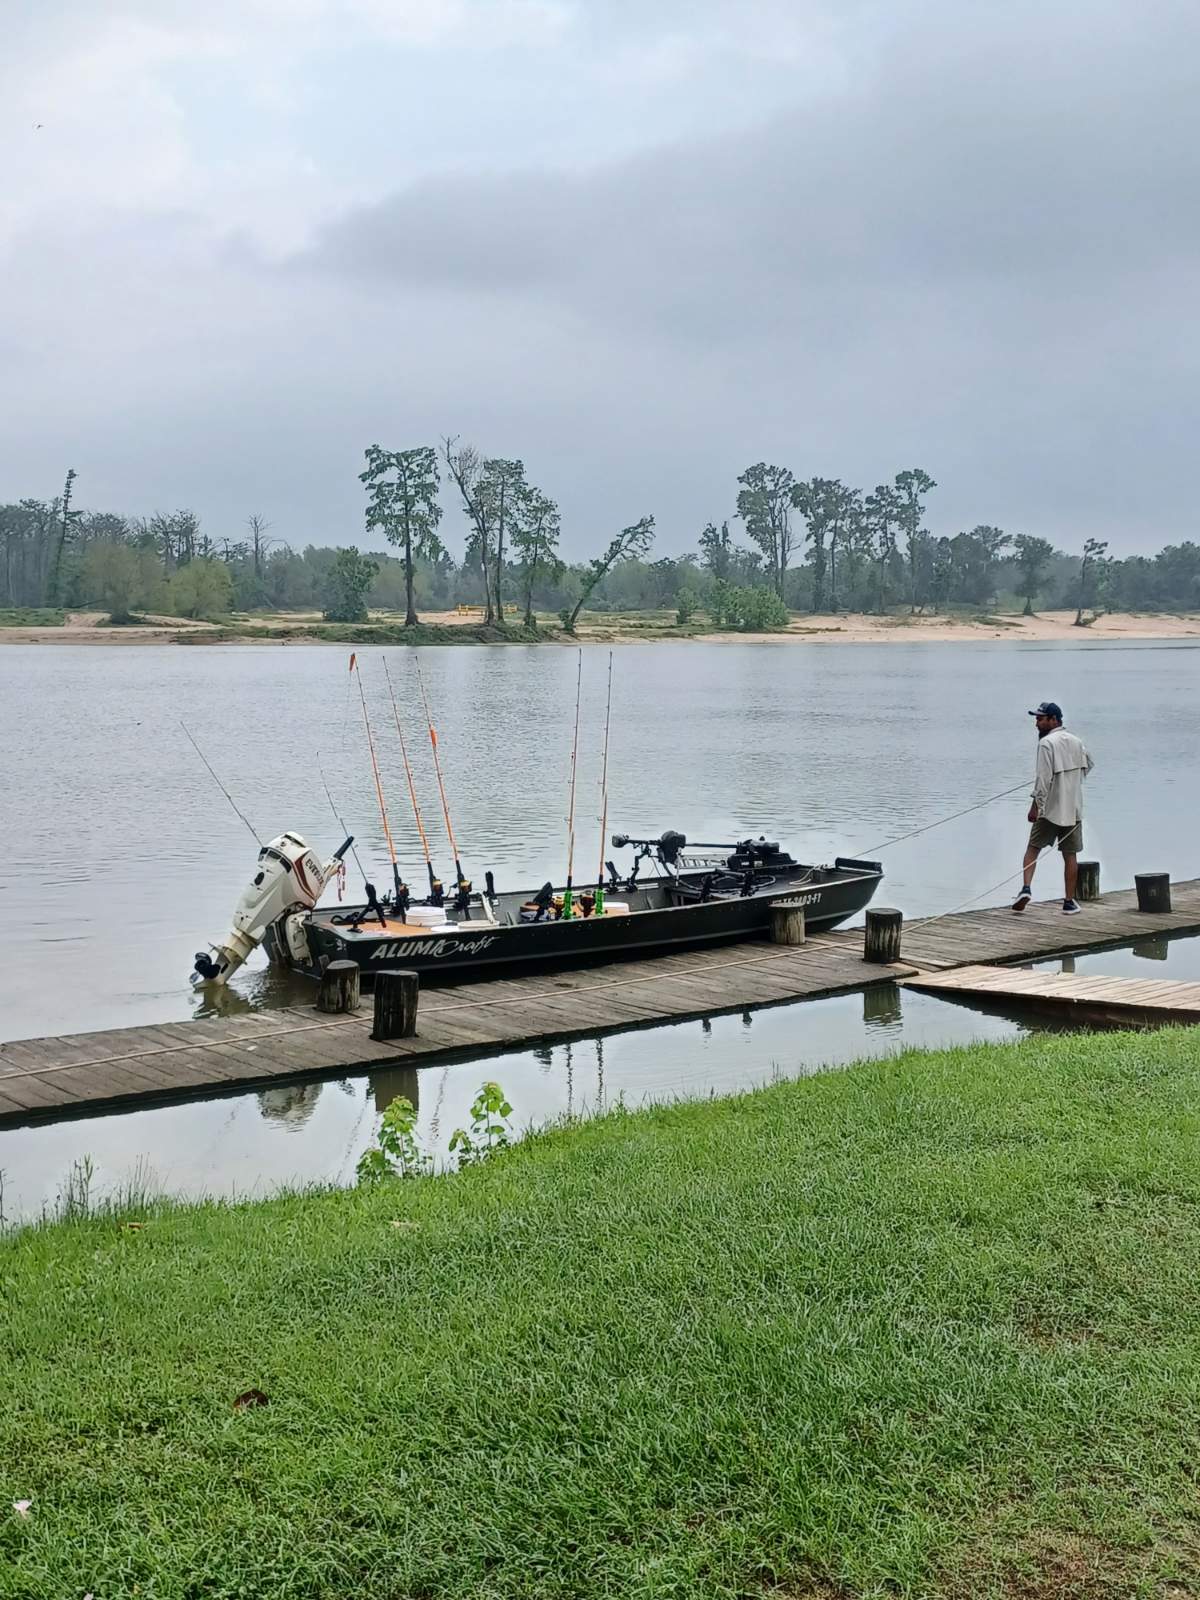
Photo Credit: Frank McMains / Shutterstock
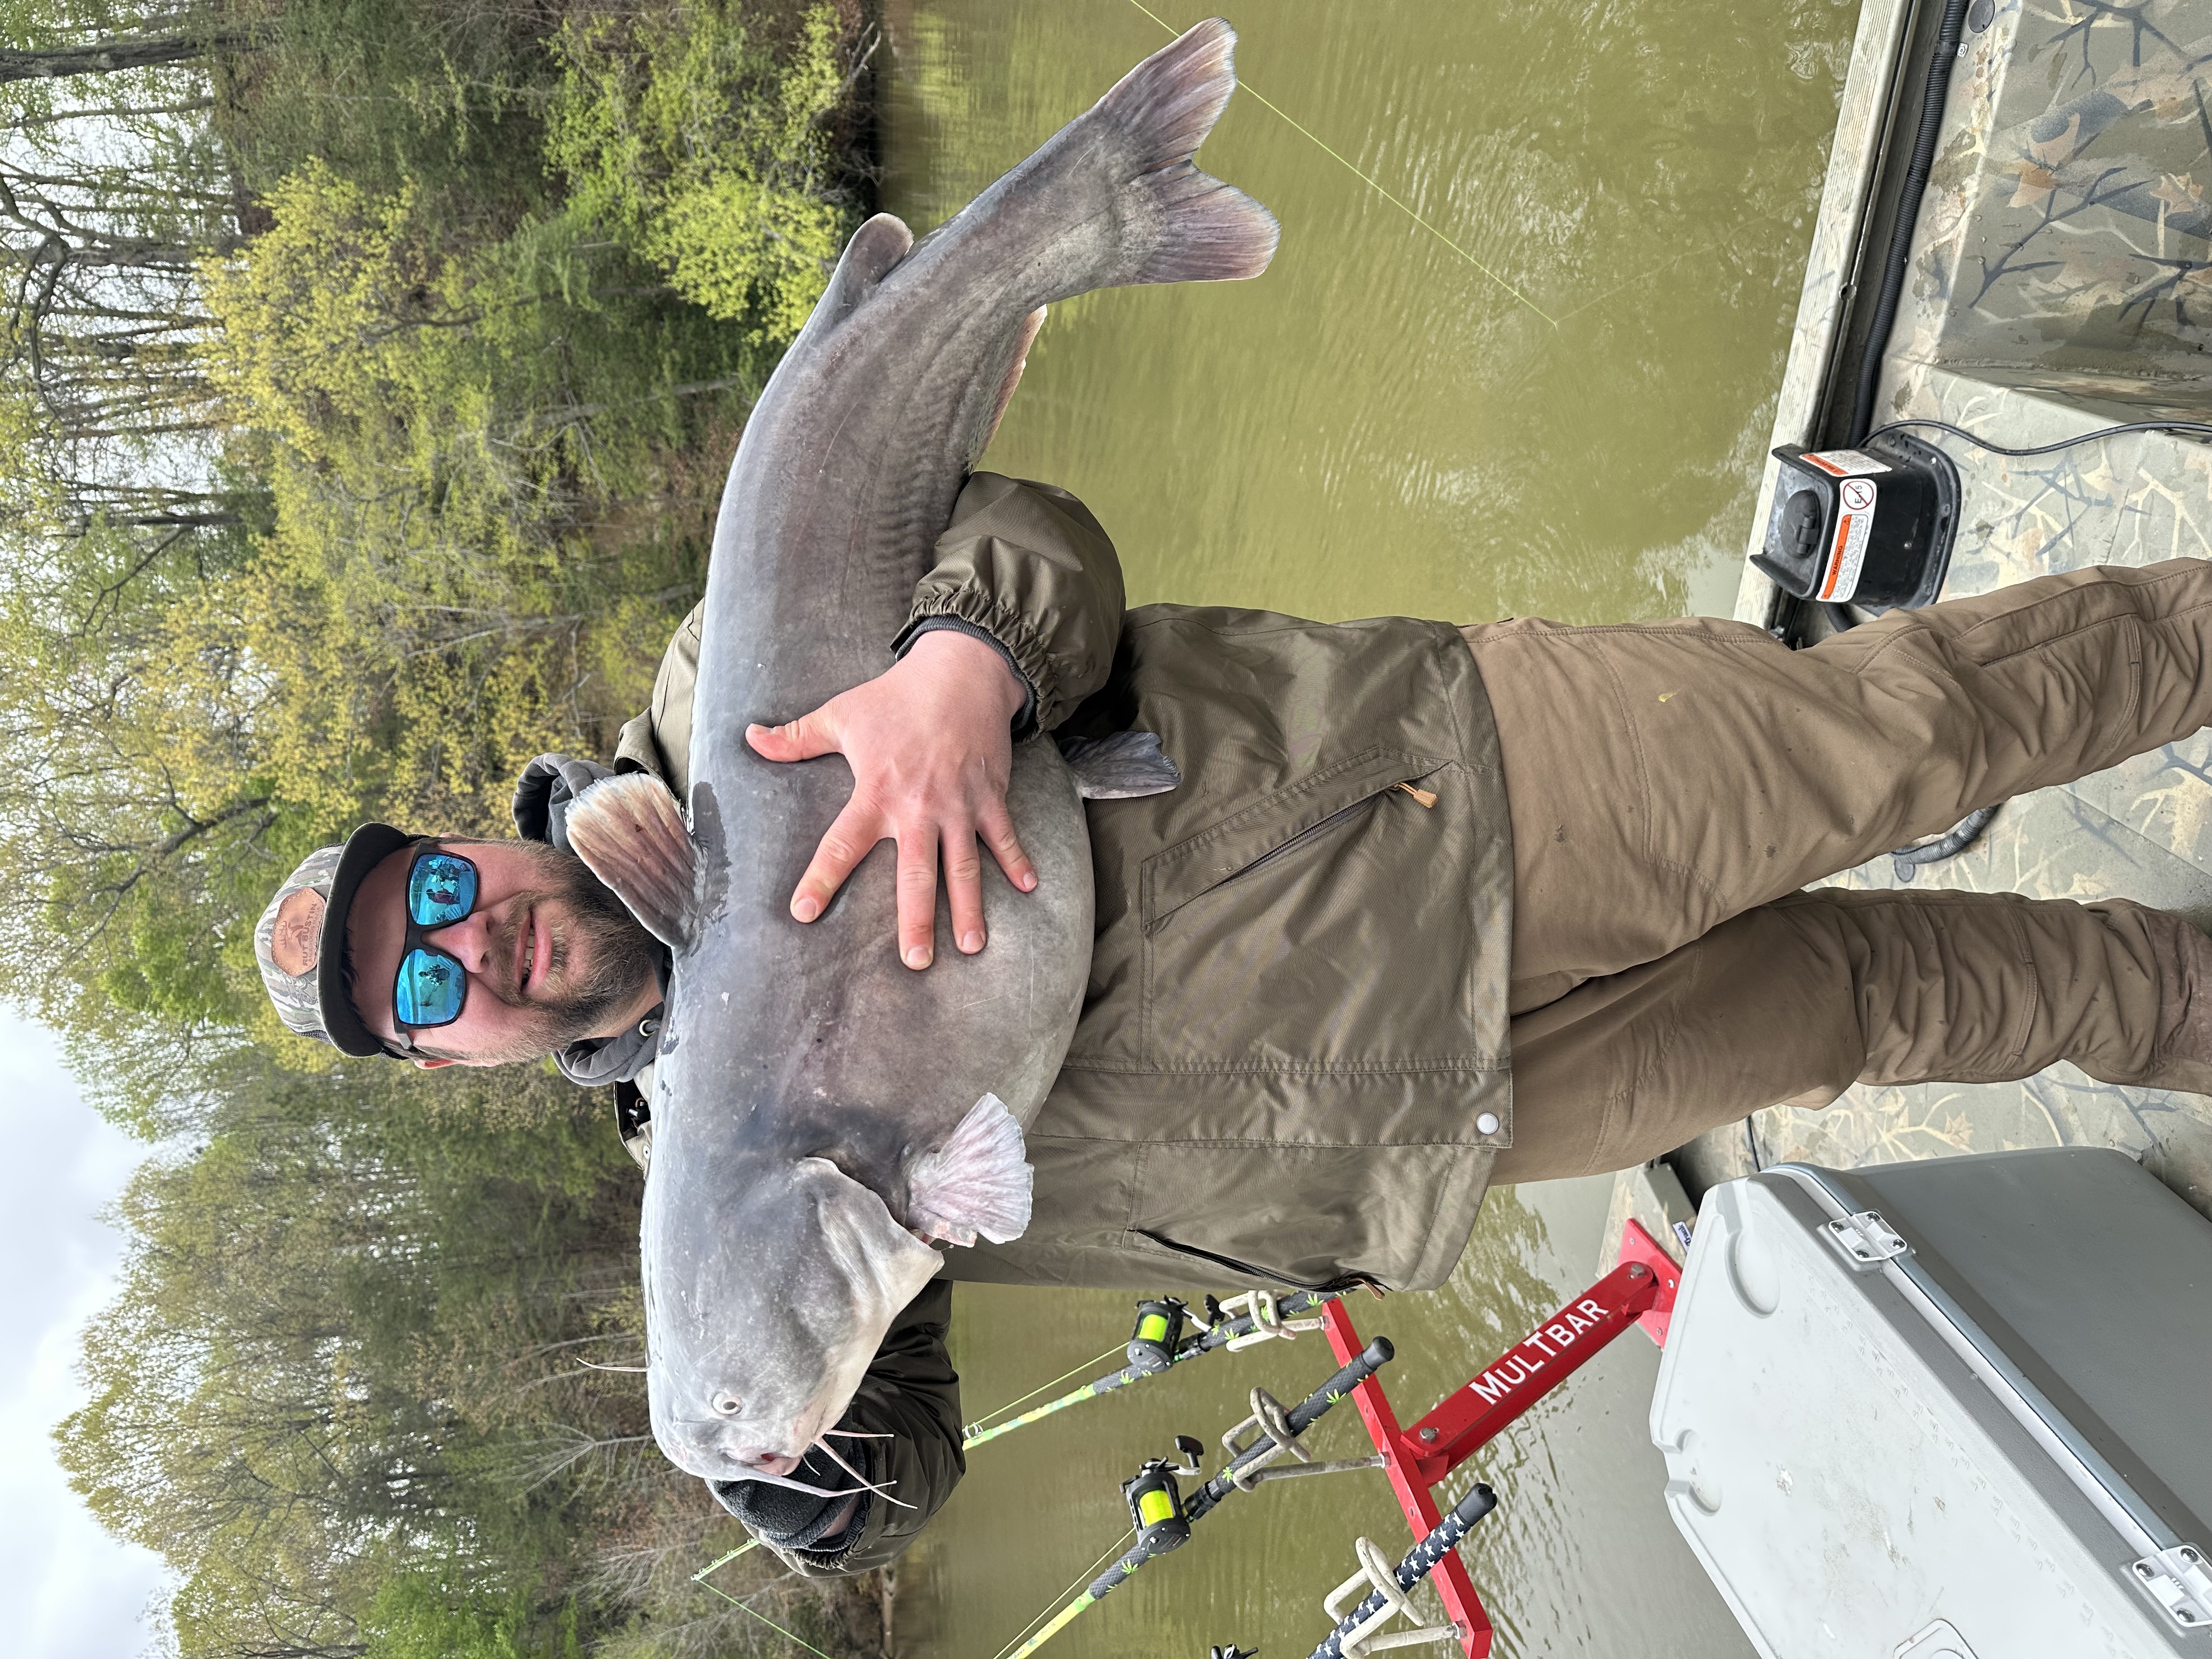
14. Louisiana
- Average annual boating fatality rate: 7.7
- Average annual boating accident rate: 34.7
- Total number of deaths (2018–2022): 119
- Total number of accidents (2018–2022): 538
- Total property damages (2018–2022): $4,660,539

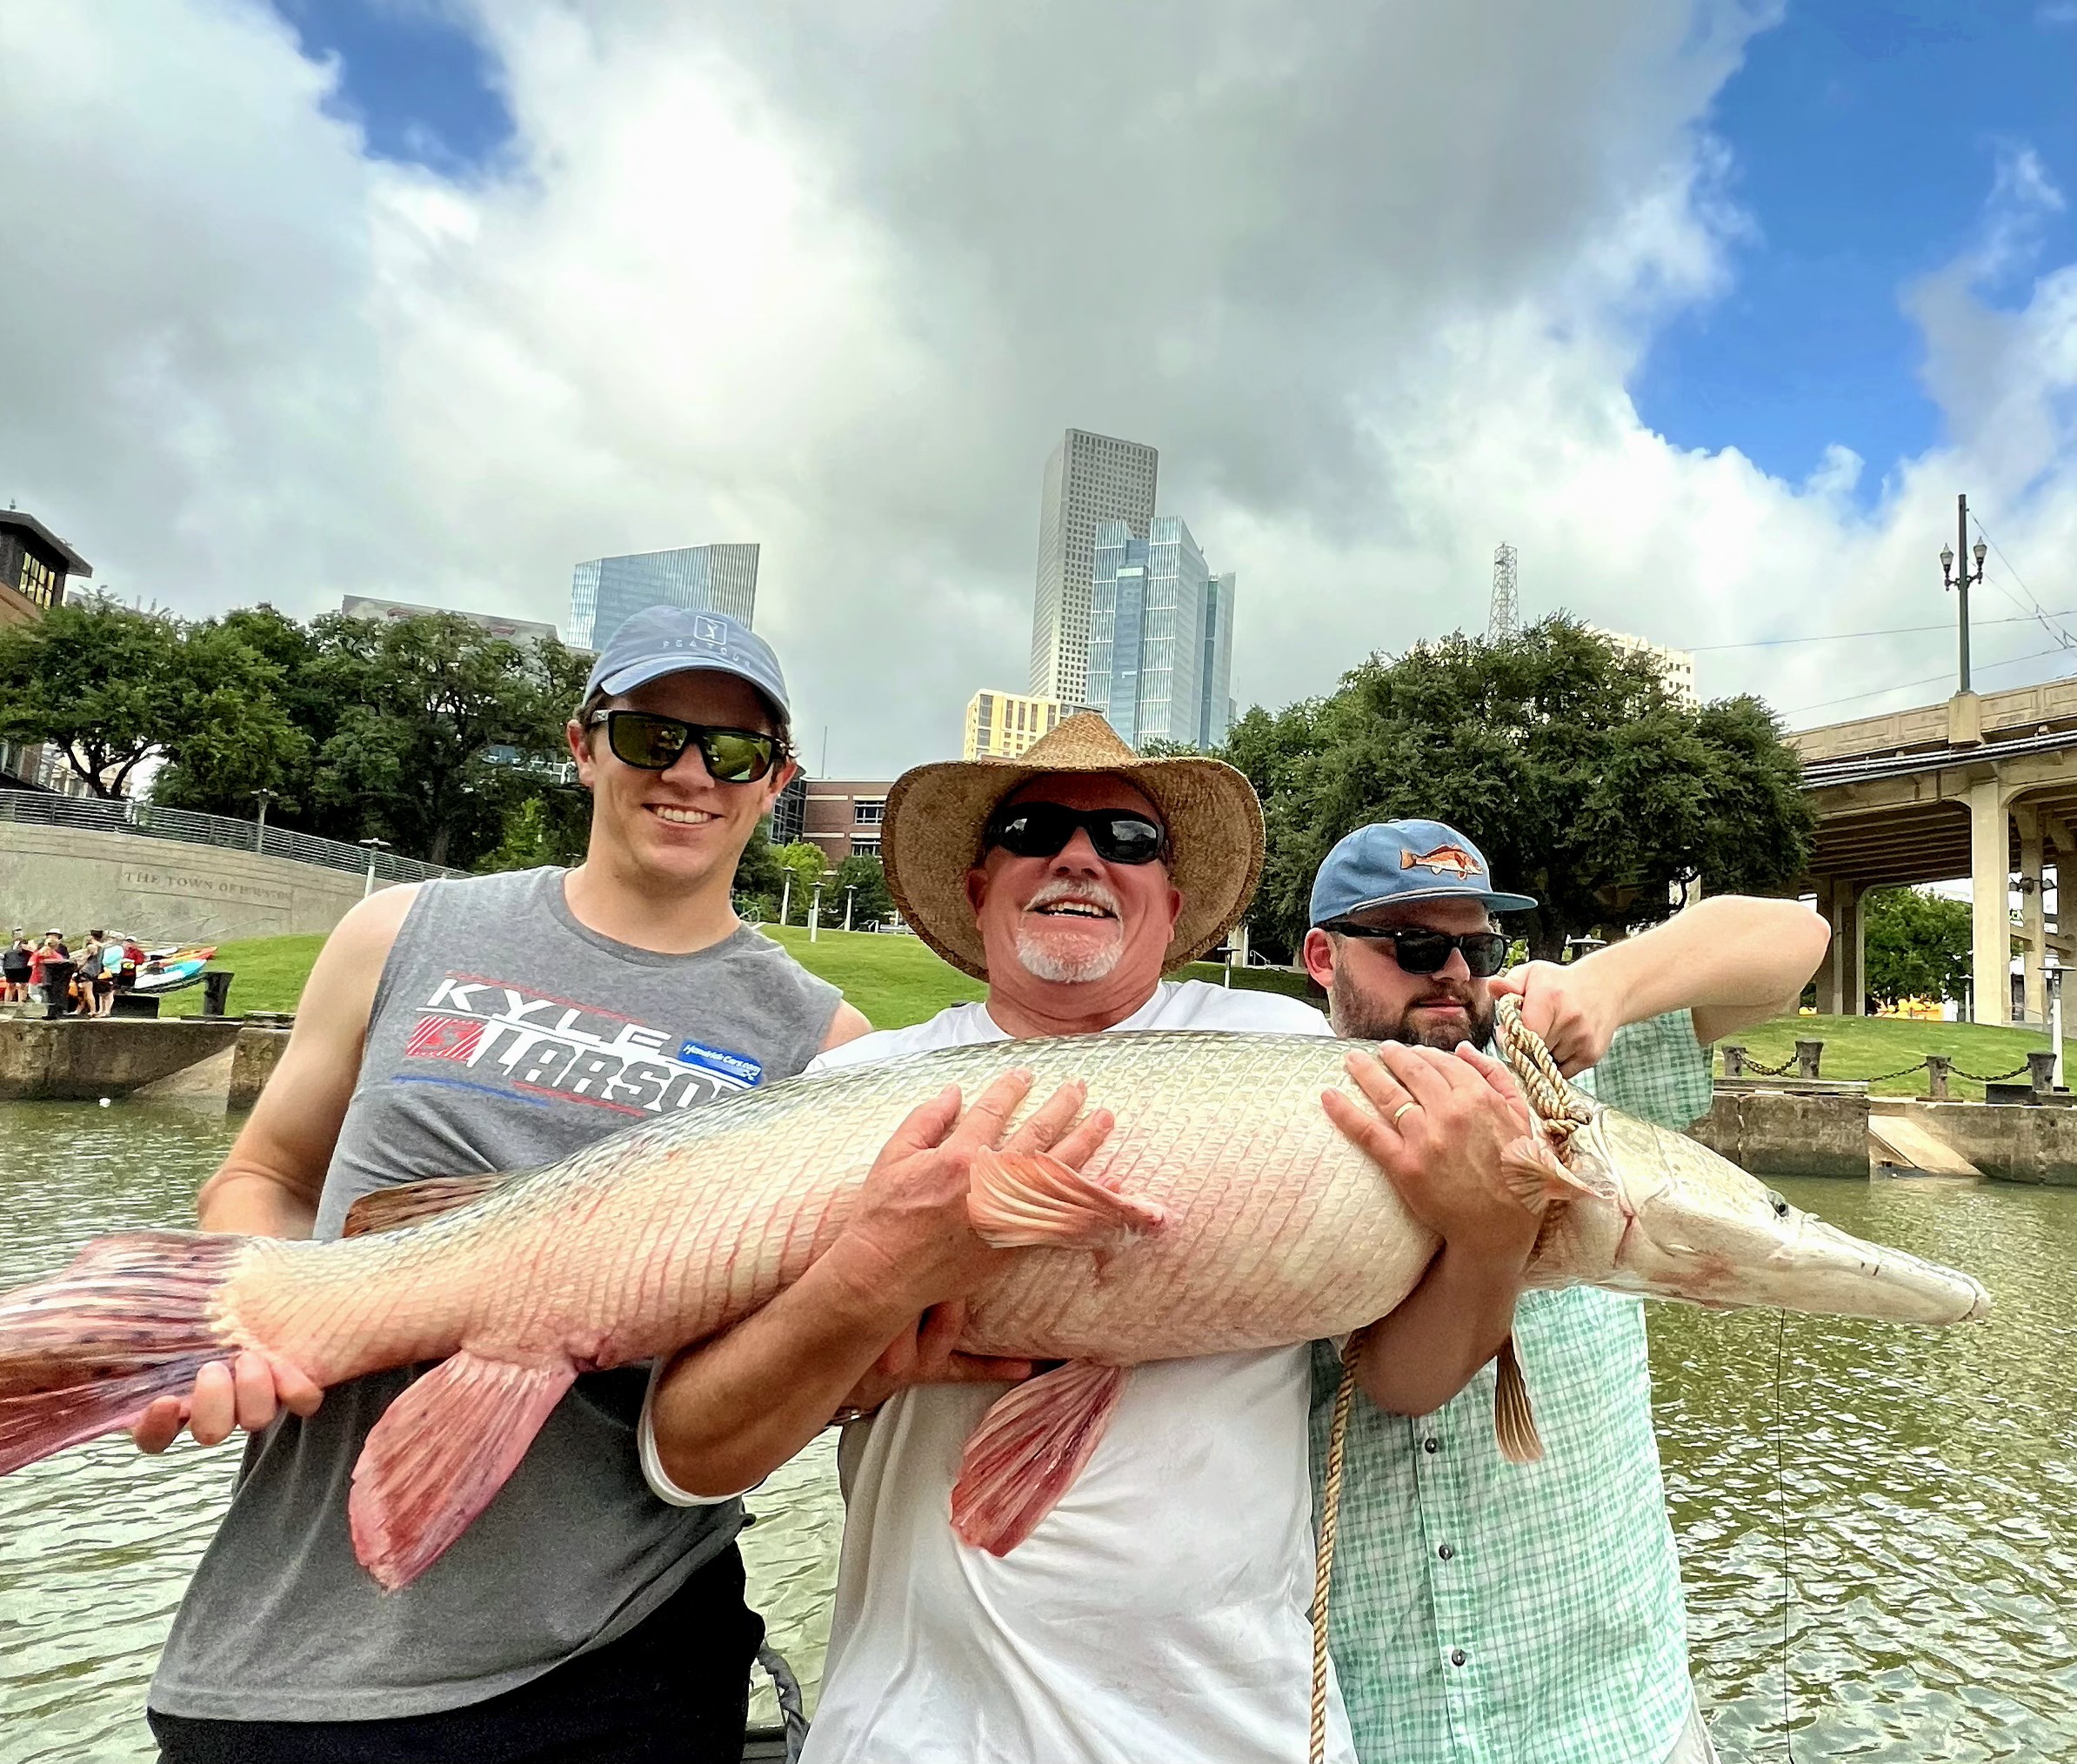
Photo Credit: JHDT Productions / Shutterstock
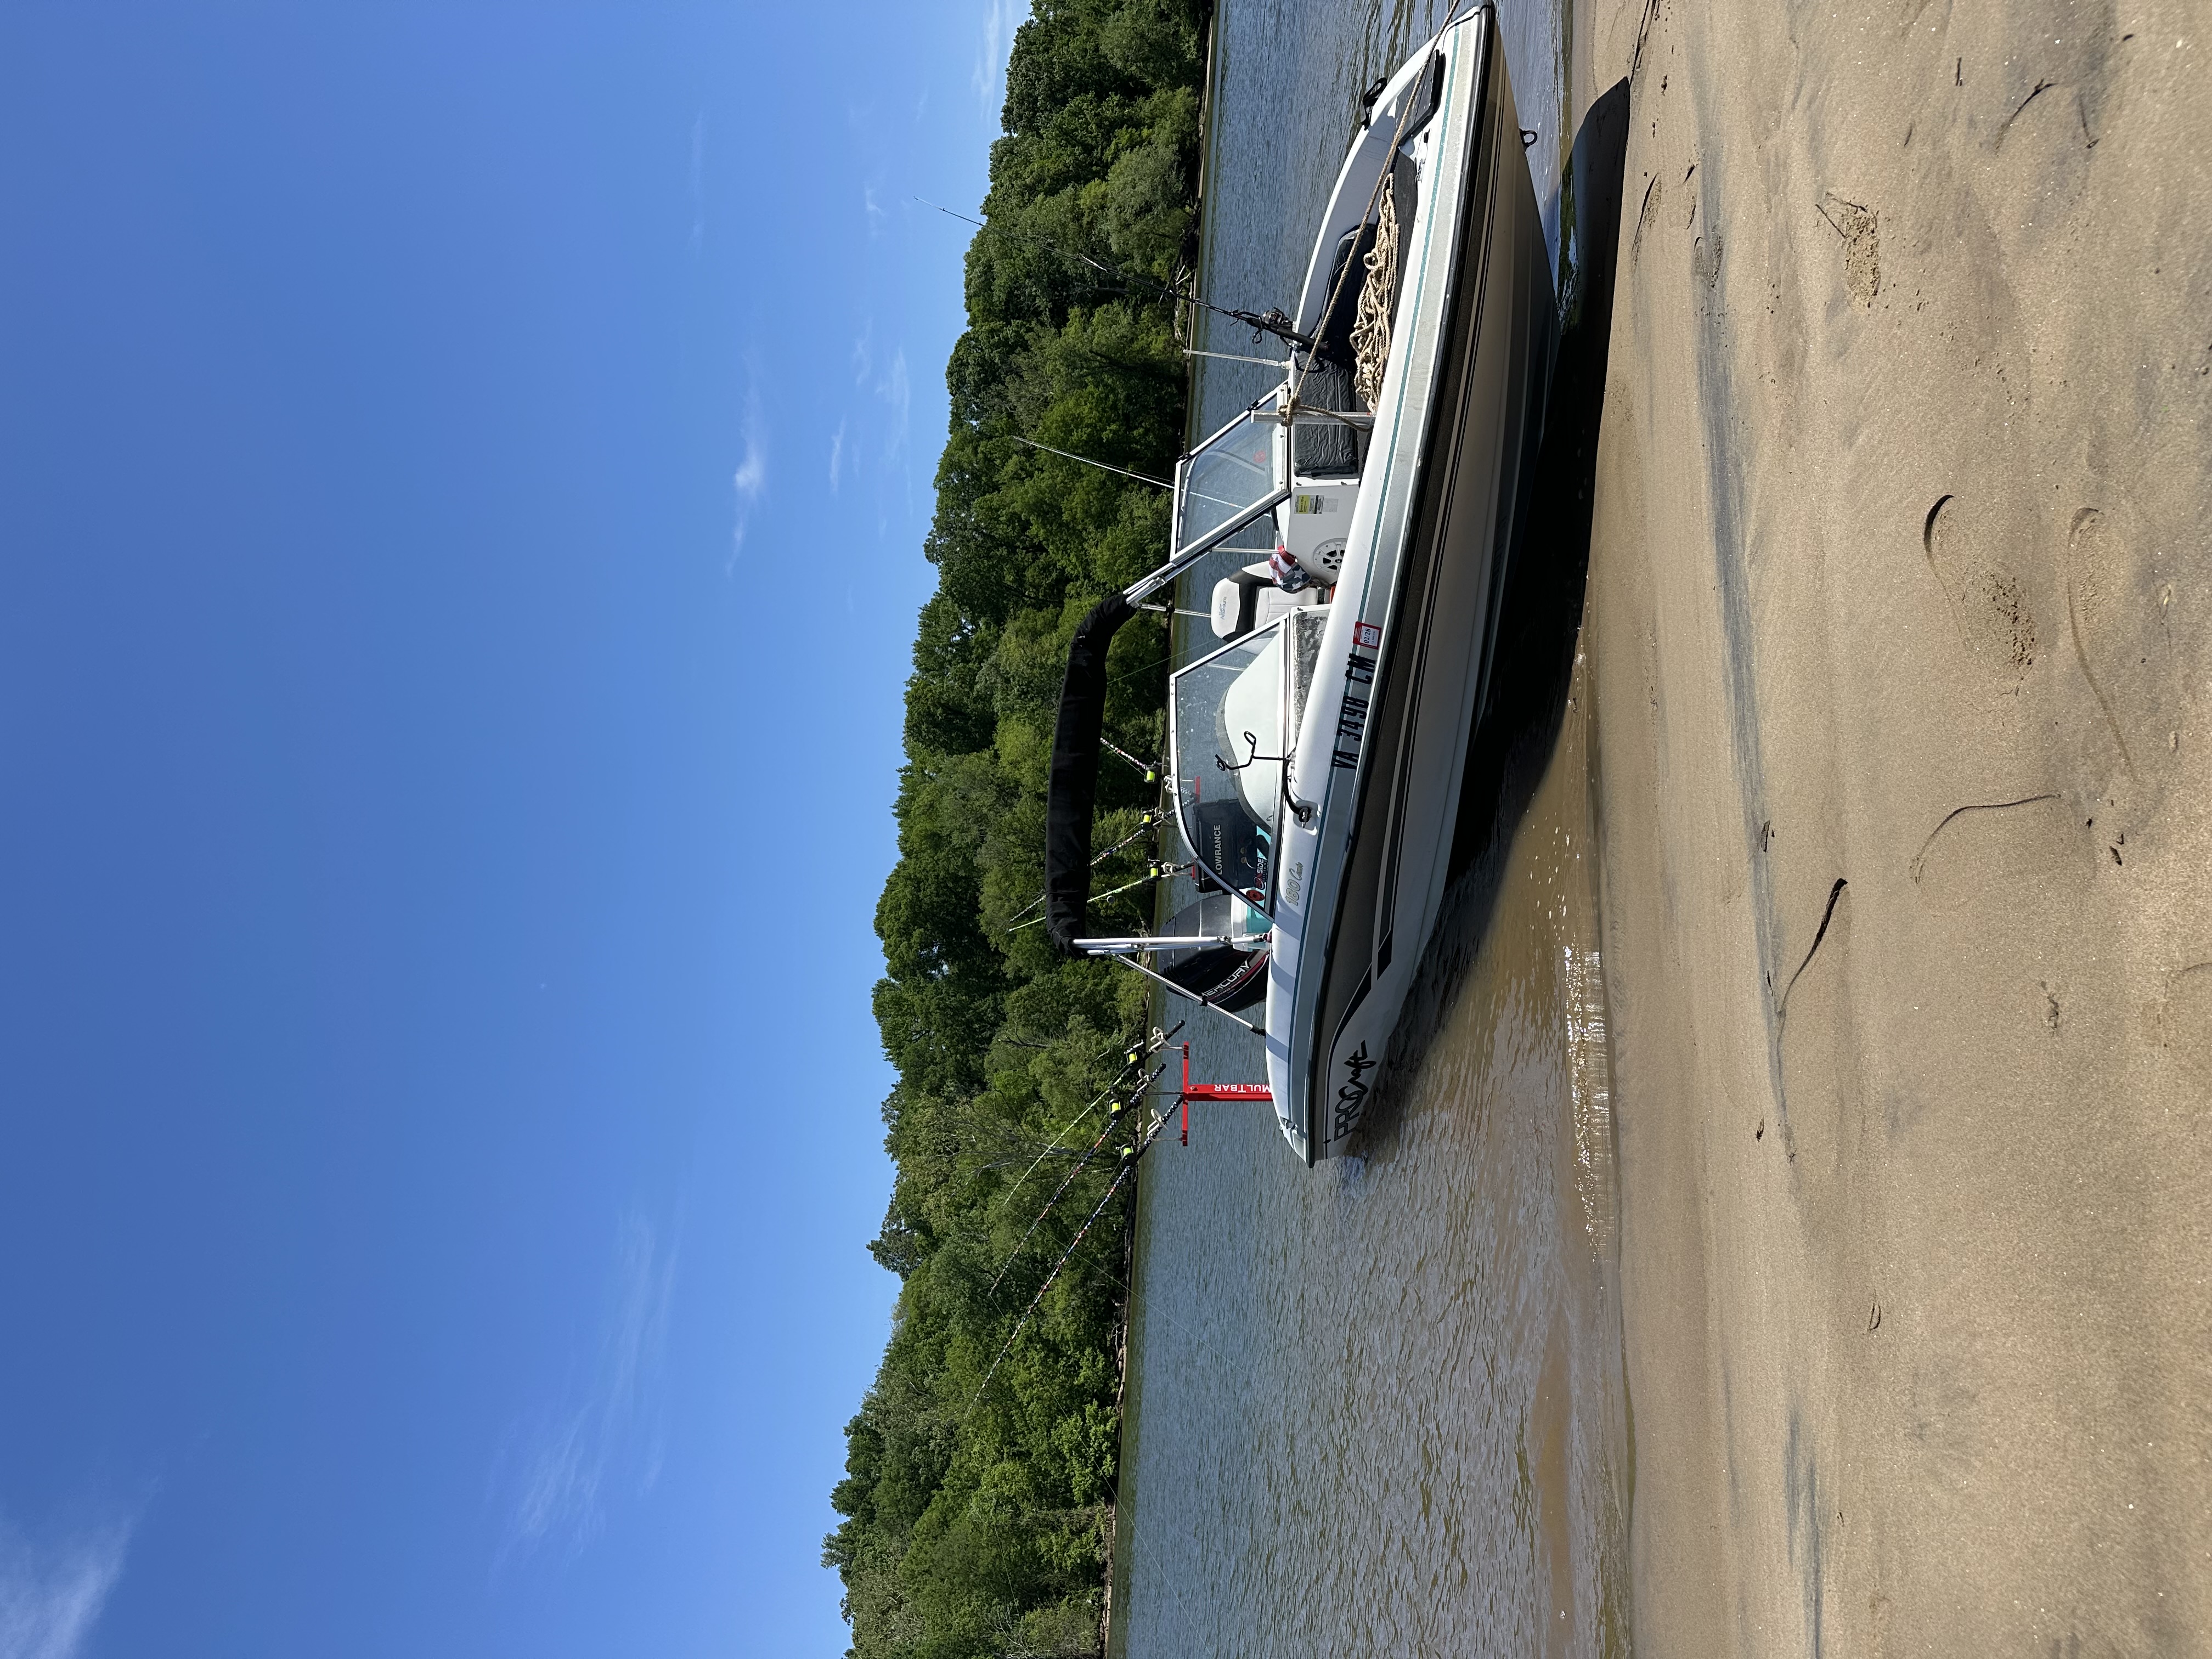
13. Texas
- Average annual boating fatality rate: 8.1
- Average annual boating accident rate: 38.8
- Total number of deaths (2018–2022): 232
- Total number of accidents (2018–2022): 1,108
- Total property damages (2018–2022): $11,737,716

Photo Credit: Laurens Hoddenbagh / Shutterstock
12. Arizona
- Average annual boating fatality rate: 8.6
- Average annual boating accident rate: 100.1
- Total number of deaths (2018–2022): 54
- Total number of accidents (2018–2022): 629
- Total property damages (2018–2022): $6,751,819

Photo Credit: CL Shebley / Shutterstock
11. Washington
- Average annual boating fatality rate: 8.8
- Average annual boating accident rate: 36.4
- Total number of deaths (2018–2022): 108
- Total number of accidents (2018–2022): 448
- Total property damages (2018–2022): $12,858,196

Photo Credit: DrivingJack Photography / Shutterstock
10. Tennessee
- Average annual boating fatality rate: 8.8
- Average annual boating accident rate: 49.5
- Total number of deaths (2018–2022): 109
- Total number of accidents (2018–2022): 610
- Total property damages (2018–2022): $10,629,680

Photo Credit: Trevor Fairbank / Shutterstock
9. Nevada
- Average annual boating fatality rate: 9.9
- Average annual boating accident rate: 101.6
- Total number of deaths (2018–2022): 21
- Total number of accidents (2018–2022): 216
- Total property damages (2018–2022): $1,501,967

Photo Credit: Appietropaolo / Shutterstock
8. Montana
- Average annual boating fatality rate: 10.6
- Average annual boating accident rate: 26.2
- Total number of deaths (2018–2022): 38
- Total number of accidents (2018–2022): 94
- Total property damages (2018–2022): $674,340

Photo Credit: Kirk Fisher / Shutterstock
7. Idaho
- Average annual boating fatality rate: 10.9
- Average annual boating accident rate: 61.3
- Total number of deaths (2018–2022): 48
- Total number of accidents (2018–2022): 270
- Total property damages (2018–2022): $2,492,419

Photo Credit: Tony Prato / Shutterstock
6. Oregon
- Average annual boating fatality rate: 11.6
- Average annual boating accident rate: 38.2
- Total number of deaths (2018–2022): 95
- Total number of accidents (2018–2022): 312
- Total property damages (2018–2022): $3,432,037

Photo Credit: Layne V. Naylor / Shutterstock
5. Utah
- Average annual boating fatality rate: 12.7
- Average annual boating accident rate: 105.9
- Total number of deaths (2018–2022): 41
- Total number of accidents (2018–2022): 343
- Total property damages (2018–2022): $3,056,861

Photo Credit: Diana Lange / Shutterstock
4. Colorado
- Average annual boating fatality rate: 13.7
- Average annual boating accident rate: 42.9
- Total number of deaths (2018–2022): 57
- Total number of accidents (2018–2022): 179
- Total property damages (2018–2022): $358,133

Photo Credit: Meg M / Shutterstock
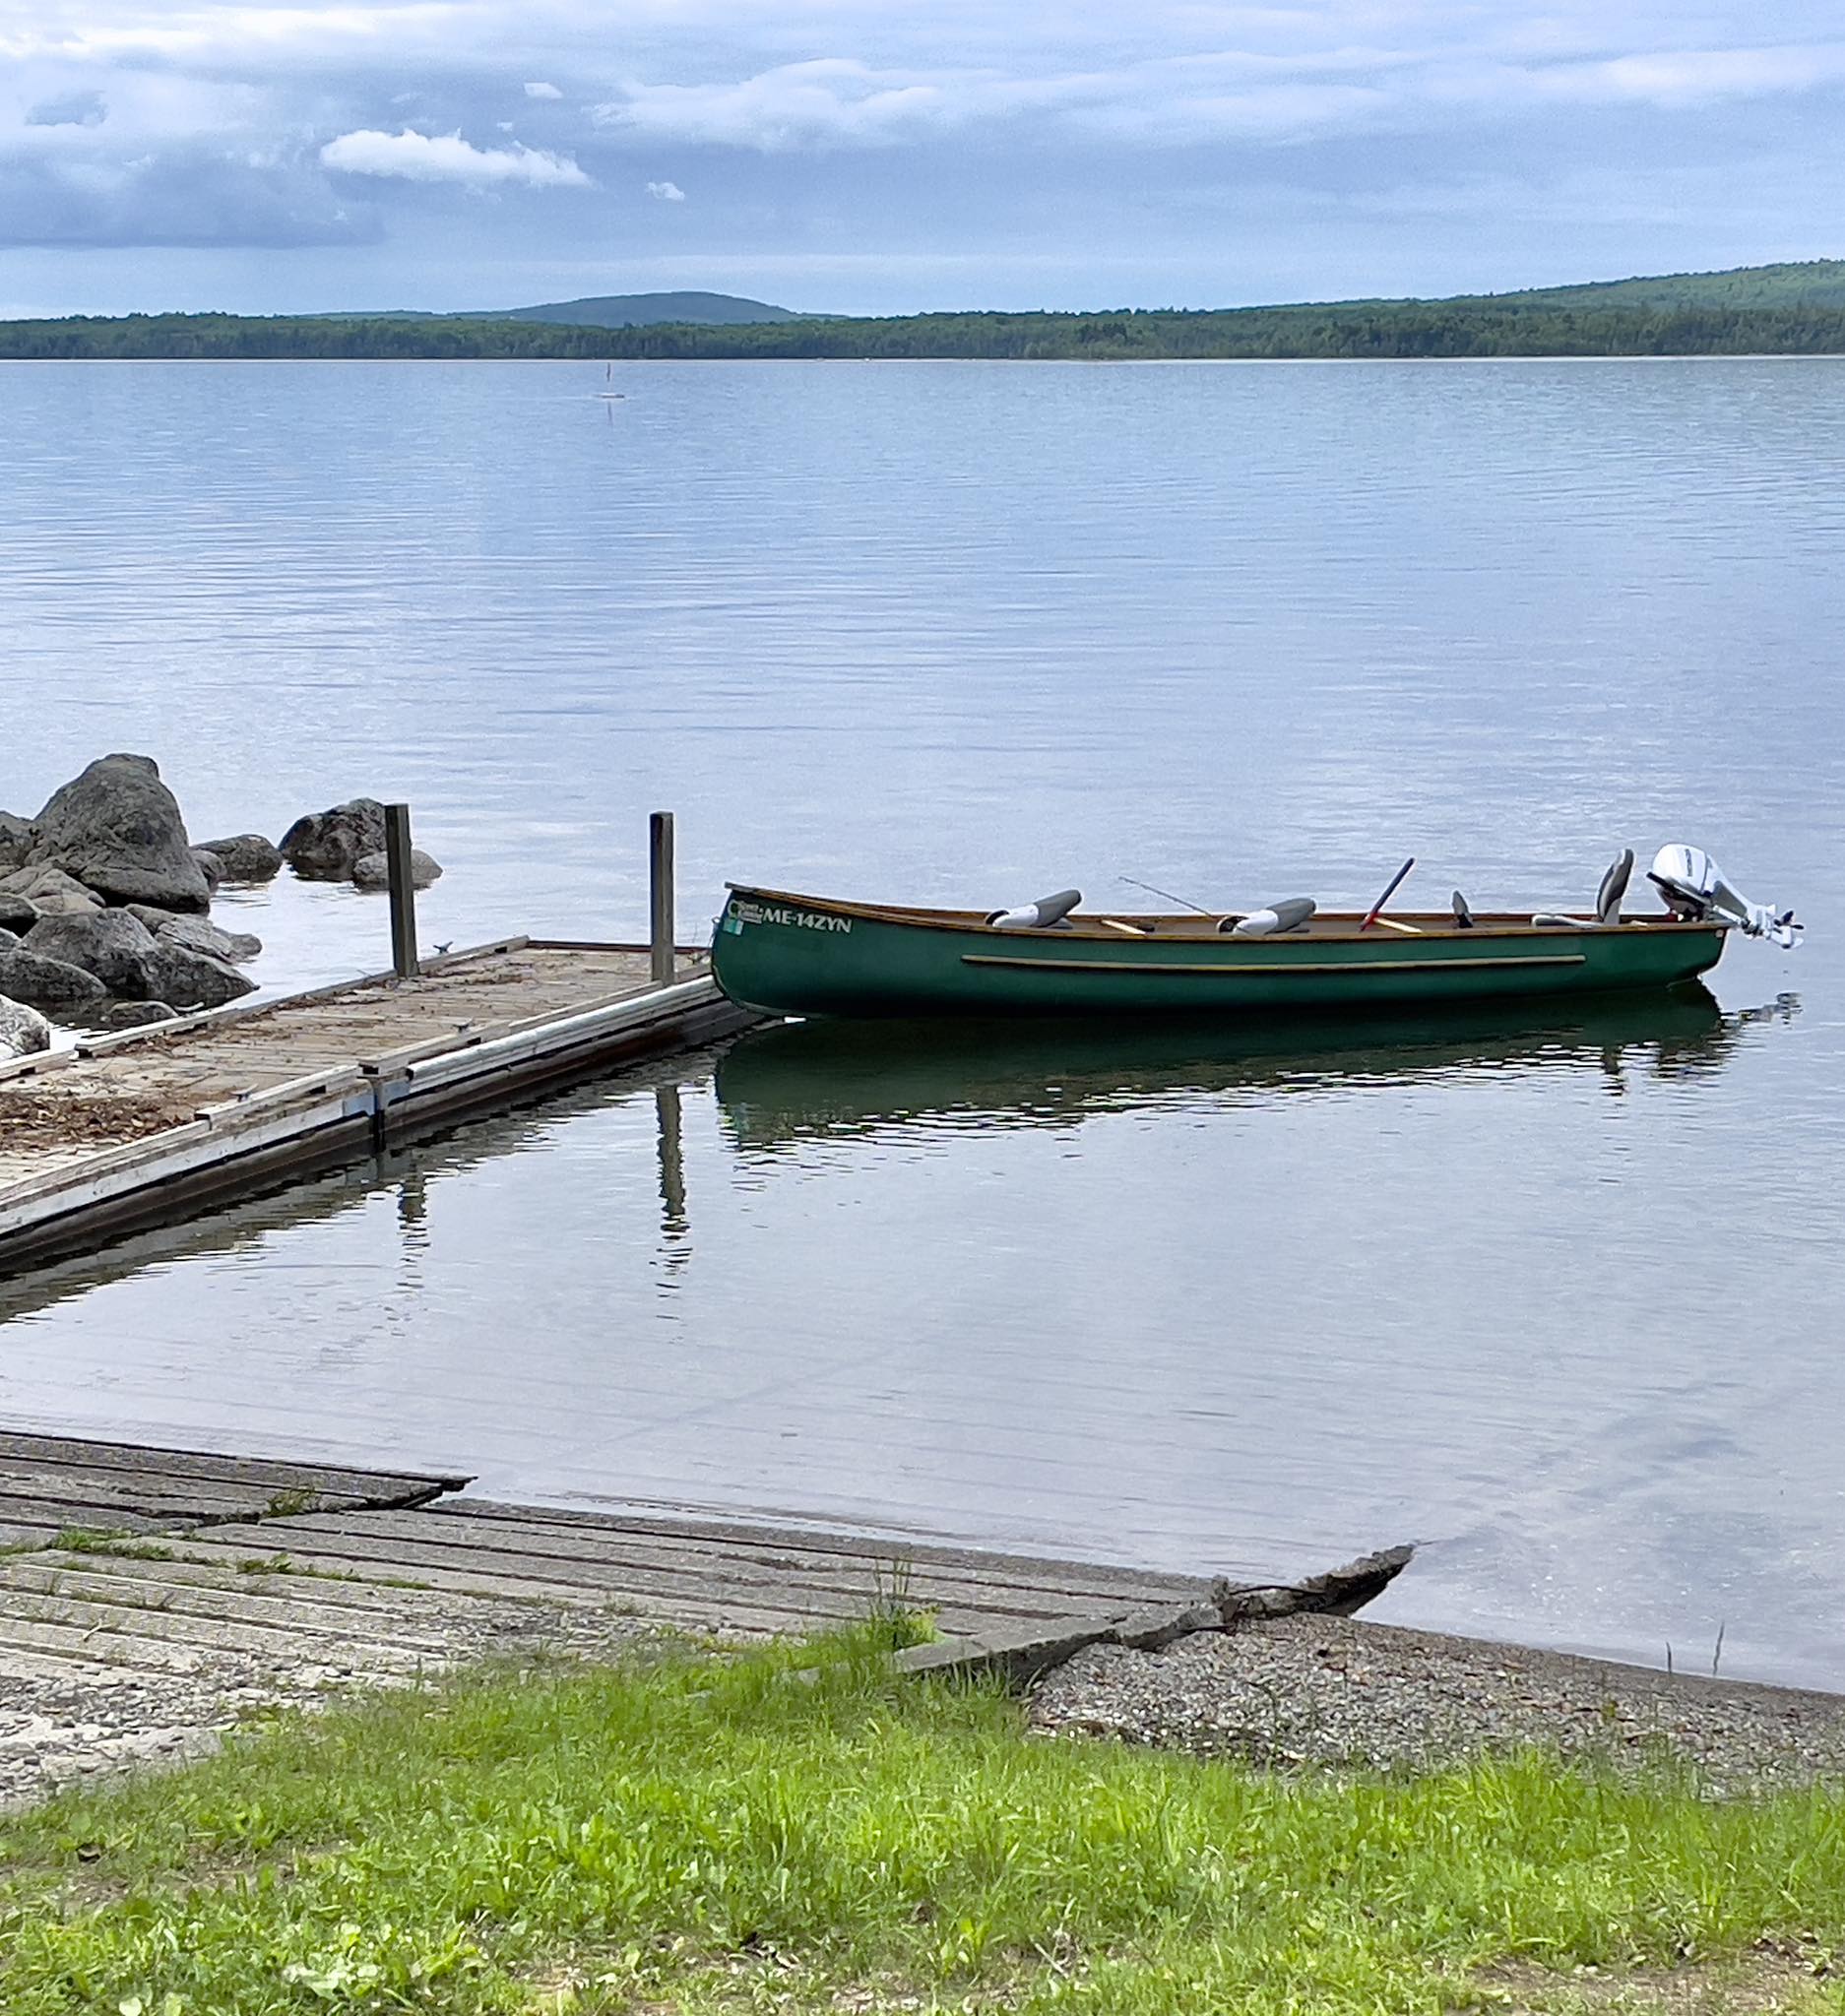
3. Vermont
- Average annual boating fatality rate: 13.9
- Average annual boating accident rate: 16.7
- Total number of deaths (2018–2022): 20
- Total number of accidents (2018–2022): 24
- Total property damages (2018–2022): $113,685
RELATED
Destin offers a range of fishing trips to suit different preferences, from short family-friendly trips to longer multi-day excursions. See our Destin fishing charters to book your next trip to the "Luckiest Fishing Village in the World."

Photo Credit: norinori303 / Shutterstock
2. Hawaii
- Average annual boating fatality rate: 23.8
- Average annual boating accident rate: 93.7
- Total number of deaths (2018–2022): 15
- Total number of accidents (2018–2022): 59
- Total property damages (2018–2022): $1,579,702

Photo Credit: Rachel Goad / Shutterstock
1. Alaska
- Average annual boating fatality rate: 33.6
- Average annual boating accident rate: 36.5
- Total number of deaths (2018–2022): 81
- Total number of accidents (2018–2022): 88
- Total property damages (2018–2022): $340,256
Methodology & Detailed Findings
The data used in this study is from the U.S. Coast Guard’s Recreational Boating Statistics, covering the five-year period from 2018–2022. To determine the states with the most boating-related fatalities, researchers at Captain Experiences calculated the average annual boating fatality rate per 100,000 registered recreational vessels in the state. In the event of a tie, the state with the higher average annual boating accident rate was ranked higher. Researchers also calculated the total number of deaths, number of accidents, and property damages over the five-year period. To improve the comparability of data across states, states that require registration of all watercraft without restrictions (such as all non-motorized vessels, canoes, kayaks, etc.) were not included.
The data is limited to recreational boating incidents reported to the Coast Guard, which is required whenever a death, missing person, personal injury, or certain amount of property damage is incurred. The Coast Guard reports that its confidence in fatality data is high; however, non-fatal accident data is considered to be underreported. For more information on reporting and requirements, see the Coast Guard’s report.
Jake Lane
Updated on August 24, 2024

October 26, 2020

August 21, 2023

November 7, 2023

April 15, 2022

May 13, 2024
Related Articles

September 11, 2024

July 14, 2023

September 12, 2024
Featured Locations
- Fishing Charters Near Me
- Austin Fishing Guides
- Biloxi Fishing Charters
- Bradenton Fishing Charters
- Cabo San Lucas Fishing Charters
- Cancun Fishing Charters
- Cape Coral Fishing Charters
- Charleston Fishing Charters
- Clearwater Fishing Charters
- Corpus Christi Fishing Charters
- Crystal River Fishing Charters
- Dauphin Island Fishing Charters
- Daytona Beach Fishing Charters
- Destin Fishing Charters
- Fort Lauderdale Fishing Charters
- Fort Myers Fishing Charters
- Fort Walton Beach Fishing Charters
- Galveston Fishing Charters
- Gulf Shores Fishing Charters
- Hatteras Fishing Charters
- Hilton Head Fishing Charters
- Islamorada Fishing Charters
- Jacksonville Fishing Charters
- Jupiter Fishing Charters
- Key Largo Fishing Charters
- Key West Fishing Charters
- Kona Fishing Charters
- Lakeside Marblehead Fishing Charters
- Marathon Fishing Charters
- Marco Island Fishing Charters
- Miami Fishing Charters
- Montauk Fishing Charters
- Morehead City Fishing Charters
- Naples Fishing Charters
- New Orleans Fishing Charters
- New Smyrna Beach Fishing Charters
- Ocean City Fishing Charters
- Orange Beach Fishing Charters
- Panama City Beach Fishing Charters
- Pensacola Fishing Charters
- Pompano Beach Fishing Charters
- Port Aransas Fishing Charters
- Port Orange Fishing Charters
- Rockport Fishing Charters
- San Diego Fishing Charters
- San Juan Fishing Charters
- Sarasota Fishing Charters
- South Padre Island Fishing Charters
- St. Augustine Fishing Charters
- St. Petersburg Fishing Charters
- Tampa Fishing Charters
- Tarpon Springs Fishing Charters
- Venice Fishing Charters
- Virginia Beach Fishing Charters
- West Palm Beach Fishing Charters
- Wilmington Fishing Charters
- Wrightsville Beach Fishing Charters

